Diagnose Missing SKAdNetwork Reporting Data Without Building a Pipeline
Diagnose Missing SKAdNetwork Reporting Data Without Building a Pipeline
SKAdNetwork reporting gives you aggregated, privacy-preserving install counts and conversion-value buckets tied to a campaign, not an individual user. It cannot show device-level journeys, and you should expect delayed postbacks, conversion-value nulls, and limited granularity. Use SKAN for campaign-level trends, then pair it with cost data to estimate CPI and ROAS.
TL;DR:
- SKAdNetwork reports offer aggregated data with limited granularity, delayed postbacks, and frequent Nulls due to privacy thresholds, especially for smaller campaigns.
- The three postbacks in SKAN 4.0 arrive over a month, with the richest data at days 3-4, and decisions should be based on trend analysis across these windows.
- Null conversion values indicate privacy thresholds weren’t met, which can be addressed by consolidating campaigns or increasing spend on high-performing sources.
- Always interpret SKAN alongside cost and device-level data, avoiding double-counting by treating it as directional rather than absolute volume.
- Properly forwarding and decoding SKAN postbacks into analytics requires specific fields and timing; using a consolidated platform simplifies tracking and diagnostics.
Table of Contents
- What SKAdNetwork Reporting Includes: Key Metrics and Terms
- How SKAN Postbacks and Reporting Windows Work
- Why SKAN Shows Nulls (And What Crowd Anonymity Tiers Mean)
- Reconciling SKAN Data With Your Tracker and Cost Reports
- How to Forward and Ingest SKAN Postbacks Into Analytics
- How an Integrated ASO and Analytics Platform Simplifies SKAN Reporting
- How SKAdNetwork Fits Into Apple’s Privacy Architecture
- How Attribution Windows and Lock Timing Affect Report Accuracy
- Building a Conversion Value Schema That Produces Useful Reports
- What Changed From SKAN 2.0 to SKAN 4.0
- Examples of SKAN Reports Driving Real Optimization Decisions
- My Take: A Short Daily Checklist for SKAN Reports
- Consolidate SKAN and ASO Signals Without Building a Custom Pipeline
- Where to Read the Technical Specs and Vendor Notes
- Sources
- FAQ
What SKAdNetwork Reporting Includes: Key Metrics and Terms
Before you can act on a SKAN report, you need to know what each column actually measures. SKAN installs come from Apple’s on-device attribution system and are counted differently from tracker installs, which your mobile measurement partner (MMP) logs through device-level signals where consent allows. The two numbers will rarely match, and that’s expected, not a bug.
The report’s real substance sits in a handful of fields:
- Conversion Value: a number from 0 to 63 (SKAN 3) that you map to in-app events like trial starts or purchases.
- Conversion Value Count: how many installs landed in each bucket.
- Conversion Value Ratio: Conversion Value Count divided by SKAN Installs, showing what share of installs carried a signal.
- Null/Unavailable: installs where Apple withheld the value due to privacy thresholds.
- fidelity_type, did_win, ad_network_id: fields identifying attribution quality and which network gets credit.
Google Ads adds a wrinkle worth knowing: it can show a redistributed conversion value segment that estimates values for nulls using modeled statistical inference, which changes your totals if you don’t isolate raw versus modeled numbers.
How SKAN Postbacks and Reporting Windows Work
SKAN 4.0 doesn’t send one postback. It sends three, each arriving later and carrying progressively less detail as Apple widens the privacy buffer around the user.
- Postback 1 arrives roughly 3 to 4 days after install, carrying the richest data, including fine-grained conversion values when the crowd anonymity tier allows.
- Postback 2 arrives around 10 to 15 days post-install, often coarser, reflecting later engagement like subscription renewals.
- Postback 3 lands at 36 to 41 days, the final word on that install’s lifecycle value.
That schedule means SKAN reporting is never real-time, and pulling a “final” number on day 5 is premature. Build your reporting cadence around these windows: treat day 4 data as an early read, day 15 as a mid-campaign check, and day 40+ as the number you actually use for budget decisions. If you optimize bids or pause campaigns based on postback 1 alone, you’re reacting to incomplete information roughly a third of the way through the attribution lifecycle.
Why SKAN Shows Nulls (And What Crowd Anonymity Tiers Mean)
A Null or Unavailable conversion value almost always means Apple’s privacy threshold wasn’t met, not that your tracking is broken. Apple only reveals data when enough installs cluster around a given ad network, source app, and campaign combination. Fall below that crowd size, and Apple withholds the value to protect the individual user’s privacy.
This is the crowd anonymity tier system, and it works on a sliding scale:
- Larger publishers and higher-volume campaigns tend to unlock more granular data.
- Smaller campaigns, niche publishers, or narrowly targeted audiences frequently see Nulls dominate their reports.
- The threshold applies per campaign, per source app, per day, so a campaign that clears the bar today may not tomorrow.
You have real levers here, even if you can’t force Apple’s hand. Consolidating fragmented campaigns into fewer, larger ones raises the odds of clearing the threshold. Increasing spend concentration on your best-performing source apps does the same. Neither guarantees full visibility, since Apple’s privacy rule is the ceiling, not your workaround.
Pro Tip: Before you assume a tracking bug, check whether Nulls spiked right after you split a campaign into smaller ad sets. Fragmentation is one of the most common, and most fixable, causes of a sudden drop in usable conversion-value data.
Reconciling SKAN Data With Your Tracker and Cost Reports
The single most common mistake in SKAdNetwork analytics is adding SKAN installs to tracker installs and treating the sum as total volume. Don’t do this. SKAN and your MMP operate as independent attribution mechanisms that can and do overlap on the same real-world install, so summing them double-counts users.
A better triage sequence when the numbers look off:
- Confirm your campaign_id is decoding correctly on the network side, since a broken mapping makes cost look disconnected from installs even when attribution is fine.
- Pull cost data directly from the ad network’s API or dashboard rather than estimating it, so CPI calculations use real spend against SKAN installs.
- Calculate Conversion Value Count divided by SKAN Installs. A low ratio tells you the report is only representative of a fraction of your installs, and any conclusion you draw from it should carry that caveat.
- Where your MMP supports it, run small-cohort retention checks against a sample of consented, device-level users to sanity-check whether your redistributed or modeled conversion values look plausible.
Treat SKAN as directional truth for trends, and your tracker as the deeper behavioral picture, rather than forcing the two into a single blended number.
How to Forward and Ingest SKAN Postbacks Into Analytics
Getting SKAN data into your analytics stack takes a bit of engineering, but the checklist is short.
- Activate postback forwarding from your ad network or MMP to your analytics endpoint. Most major networks support forwarding raw or decoded postbacks to a receiving URL you configure.
- Capture the required fields: campaign_id, conversion_value, fidelity_type, did_win, transaction_id, ad_network_id, and the SKAN version. Missing any one of these breaks downstream modeling.
- For Google Analytics, send a campaign_details event via Measurement Protocol, registering conversion_value, fidelity_type, and version as custom parameters, and do it within the allowed windows so the modeling has fresh data.
- Validate before you trust it: fire test events, check that timestamps land inside the expected postback windows, and confirm conversion modeling is actually running against the ingested data rather than silently failing.
Google’s own guidance is specific on timing here: postbacks should be sent within about four days of install for the most accurate conversion modeling, which lines up almost exactly with SKAN’s first postback window.
How an Integrated ASO and Analytics Platform Simplifies SKAN Reporting
Reconciling SKAN with store performance gets complicated fast when your Firebase data, Google Analytics, and ad network dashboards all live in separate tabs. Apptenium pulls those signals into one view, so a weak conversion-value ratio in your SKAN report can be checked against store conversion rate, keyword visibility, and retention cohorts without exporting five spreadsheets.
Apptenium’s AI-powered recommendations flag likely causes when conversion values skew low, whether that’s a listing problem, a UX drop-off, or a targeting mismatch upstream. After a fresh batch of postbacks arrives, the practical workflow is straightforward: check the conversion-value ratio first, cross-reference retention cohorts second, and confirm keyword visibility hasn’t shifted third, all from the same ASO features dashboard.
How SKAdNetwork Fits Into Apple’s Privacy Architecture
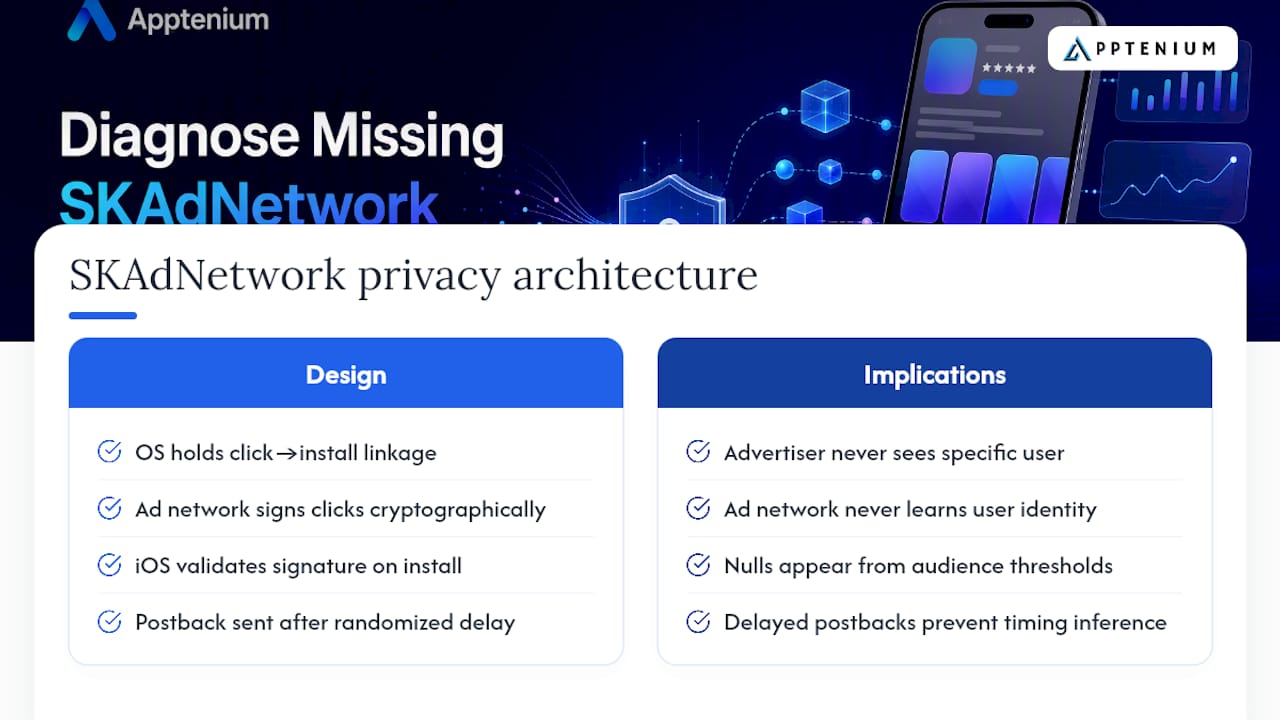
SKAdNetwork exists because Apple decided device-level, cross-app tracking was incompatible with its privacy commitments. Rather than banning attribution outright, Apple built a system where the operating system itself, not the advertiser or the ad network, holds the sensitive linkage between an ad click and an install.
The architecture works like this: when a user taps an ad, the ad network signs the click with a cryptographic signature tied to specific parameters. If an install follows, iOS validates that signature and, after a randomized delay of its choosing, sends a postback containing only the aggregated data Apple permits. The advertiser never sees which specific user converted. The ad network never learns the user’s identity. Apple’s own documentation frames SKAdNetwork as a privacy-first, aggregate attribution system, and that framing matters because it explains every limitation you’ll run into.
Every quirk in SKAN reporting traces back to this design choice. Nulls exist because Apple enforces minimum audience sizes before revealing anything. Postbacks are delayed because instant reporting would make it trivial to infer identity from timing. Conversion values are capped at a small set of buckets because granular numeric data leaks more information than a coarse bucket does. None of this is an accident or an oversight you can engineer around. It’s the privacy framework functioning as designed, and the practical implication for marketers is that SKAN should be treated as a privacy-safe source of truth for volume and rough conversion trends, with your MMP and analytics stack filling in the cost and cohort context Apple deliberately withholds.
How Attribution Windows and Lock Timing Affect Report Accuracy
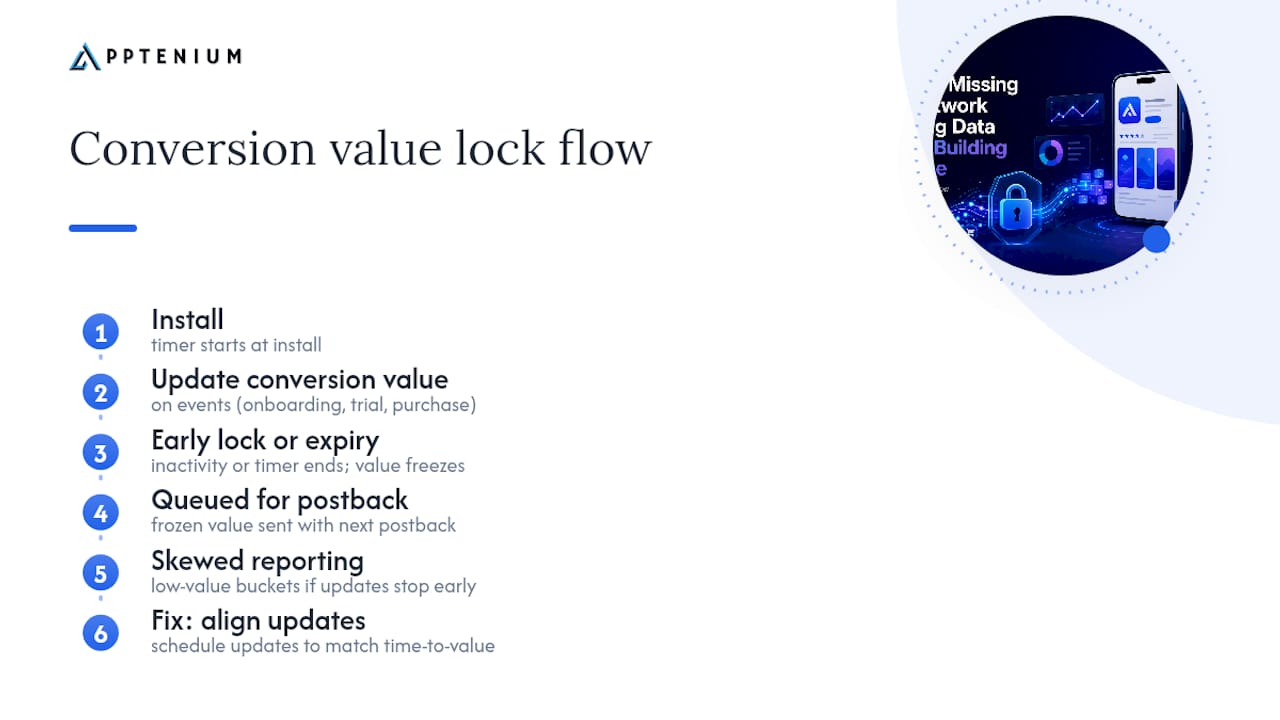
The conversion value you see in a SKAN report isn’t a snapshot of “everything the user did.” It’s a snapshot of everything the user did before their conversion value lock timer expired, and that timing detail changes how you should read every number in the report.
Here’s the mechanic: once an install happens, a timer starts. You, as the advertiser, can update the conversion value as new in-app events fire (a completed onboarding, a trial start, a first purchase). But once that timer runs out, or once a period of app inactivity triggers early lock, the value freezes and gets queued for the next postback. If your highest-value event, say a subscription upgrade, typically happens on day 12 but your conversion value logic only updates through day 3, you’ll systematically undercount your best users.
This is where a lot of SKAN data interpretation goes wrong. Marketers see a conversion value distribution skewed toward low-value buckets and conclude the campaign is underperforming, when the real issue is that the lock window closed before the valuable behavior occurred. Fixing this isn’t about the report. It’s about redesigning when and how often you update the conversion value during the active window, so the lock captures behavior that’s actually representative of user quality.
Practically, that means mapping your typical time-to-value curve for key events, then setting your conversion value update logic to check in at intervals that match how your users actually behave, not an arbitrary schedule copied from a blog post about a different app category.
Building a Conversion Value Schema That Produces Useful Reports
A conversion value schema is the logic that decides which number, 0 through 63, gets assigned to a given user’s behavior. Get the schema wrong and every downstream report inherits that flaw, no matter how clean your postback forwarding is.
The most common failure is cramming too many unrelated signals into one linear scale. A schema that tries to represent revenue, engagement depth, and retention all in a single 6-bit number tends to produce buckets that mean different things for different users, which makes the resulting report nearly impossible to act on with confidence.
A more useful approach separates concerns deliberately:
- Reserve a portion of your value range for monetary milestones (first purchase, cumulative revenue tiers).
- Reserve another portion for engagement depth (sessions completed, key feature usage).
- Weight toward the events that correlate most strongly with long-term retention in your own historical data, not generic industry assumptions.
Revisit the schema on a fixed cadence, quarterly is reasonable for most apps, because user behavior drifts and an event that predicted retention a year ago may not predict it today. Document the mapping outside the ad network’s interface too. When conversion value 42 shows unusually strong performance in this month’s report, you need to know instantly what behavior that bucket represents, not reverse-engineer it from memory.
What Changed From SKAN 2.0 to SKAN 4.0
SKAN 2.0 gave marketers a single postback, one conversion value, and a fixed 24 to 48 hour window to update it before the value locked permanently. That simplicity was also its biggest limitation: any user behavior after that window closed simply never made it into a report.
SKAN 3.0 extended the picture by introducing a second, coarser postback and lock-window flexibility, giving marketers a slightly longer runway to capture meaningful events. It also introduced source app filtering, which let advertisers see which publisher apps were driving installs, subject to the same privacy thresholds.
SKAN 4.0 is the version most marketers are working with now, and it’s a meaningfully bigger architecture. It added the three-postback structure covered earlier, introduced crowd anonymity tiers that scale data granularity with campaign size, and added web-to-app measurement support for browser-originated installs. It also introduced the ability to send different levels of detail (fine versus coarse conversion values) depending on which anonymity tier a given install qualifies for, rather than the older all-or-nothing null behavior.
The practical takeaway for SKAdNetwork reporting: if your dashboards or MMP integration were built for SKAN 2.0 logic, they’re likely missing the second and third postback entirely, undercounting long-tail conversion events, and misreading tier-based data suppression as tracking failure. Confirm your current SKAN reporting tools are actually configured for version 4 before trusting any conclusion drawn from the report.
Examples of SKAN Reports Driving Real Optimization Decisions
A campaign showing a strong SKAN install count but a Conversion Value Ratio under 30% is telling you something specific: most of those installs never generated a usable signal, likely due to privacy thresholds suppressing the values rather than users failing to convert. The fix there usually isn’t creative or targeting, it’s consolidating campaign structure to clear the crowd anonymity bar.
A different pattern: a network reporting strong postback 1 numbers that dry up by postback 3, particularly on conversion values tied to purchase events. That shape often means the network is very good at driving installs but poor at driving the deeper engagement that shows up only in later postbacks, a strong candidate for a mid-funnel creative or targeting audit before you reduce spend.
A third case worth watching: comparing SKAN installs against tracker installs and noticing the gap widening month over month specifically on one source app. That divergence frequently signals a fidelity_type shift, like more traffic moving from view-through to click-through attribution, or a publisher’s inventory changing in ways that affect how Apple’s system credits the install.
None of these patterns are visible from a single day’s snapshot. They emerge only when you’re tracking the SKAN report across weeks, comparing conversion-value distribution shape against prior campaigns, and treating a sudden shift as a diagnostic clue rather than noise to average away.
My Take: A Short Daily Checklist for SKAN Reports
Favor trends over daily noise, and never read a SKAN number without pairing it against cost. That’s the whole operating rule.
Each morning, I’d check three things: did postbacks actually arrive on schedule, has the conversion-value ratio moved meaningfully instead of just jittered, and does the install-to-cost mapping still make sense. If forwarding looks stale or a cohort check contradicts the redistributed values, fix that before touching bids.
— Mike
Consolidate SKAN and ASO Signals Without Building a Custom Pipeline
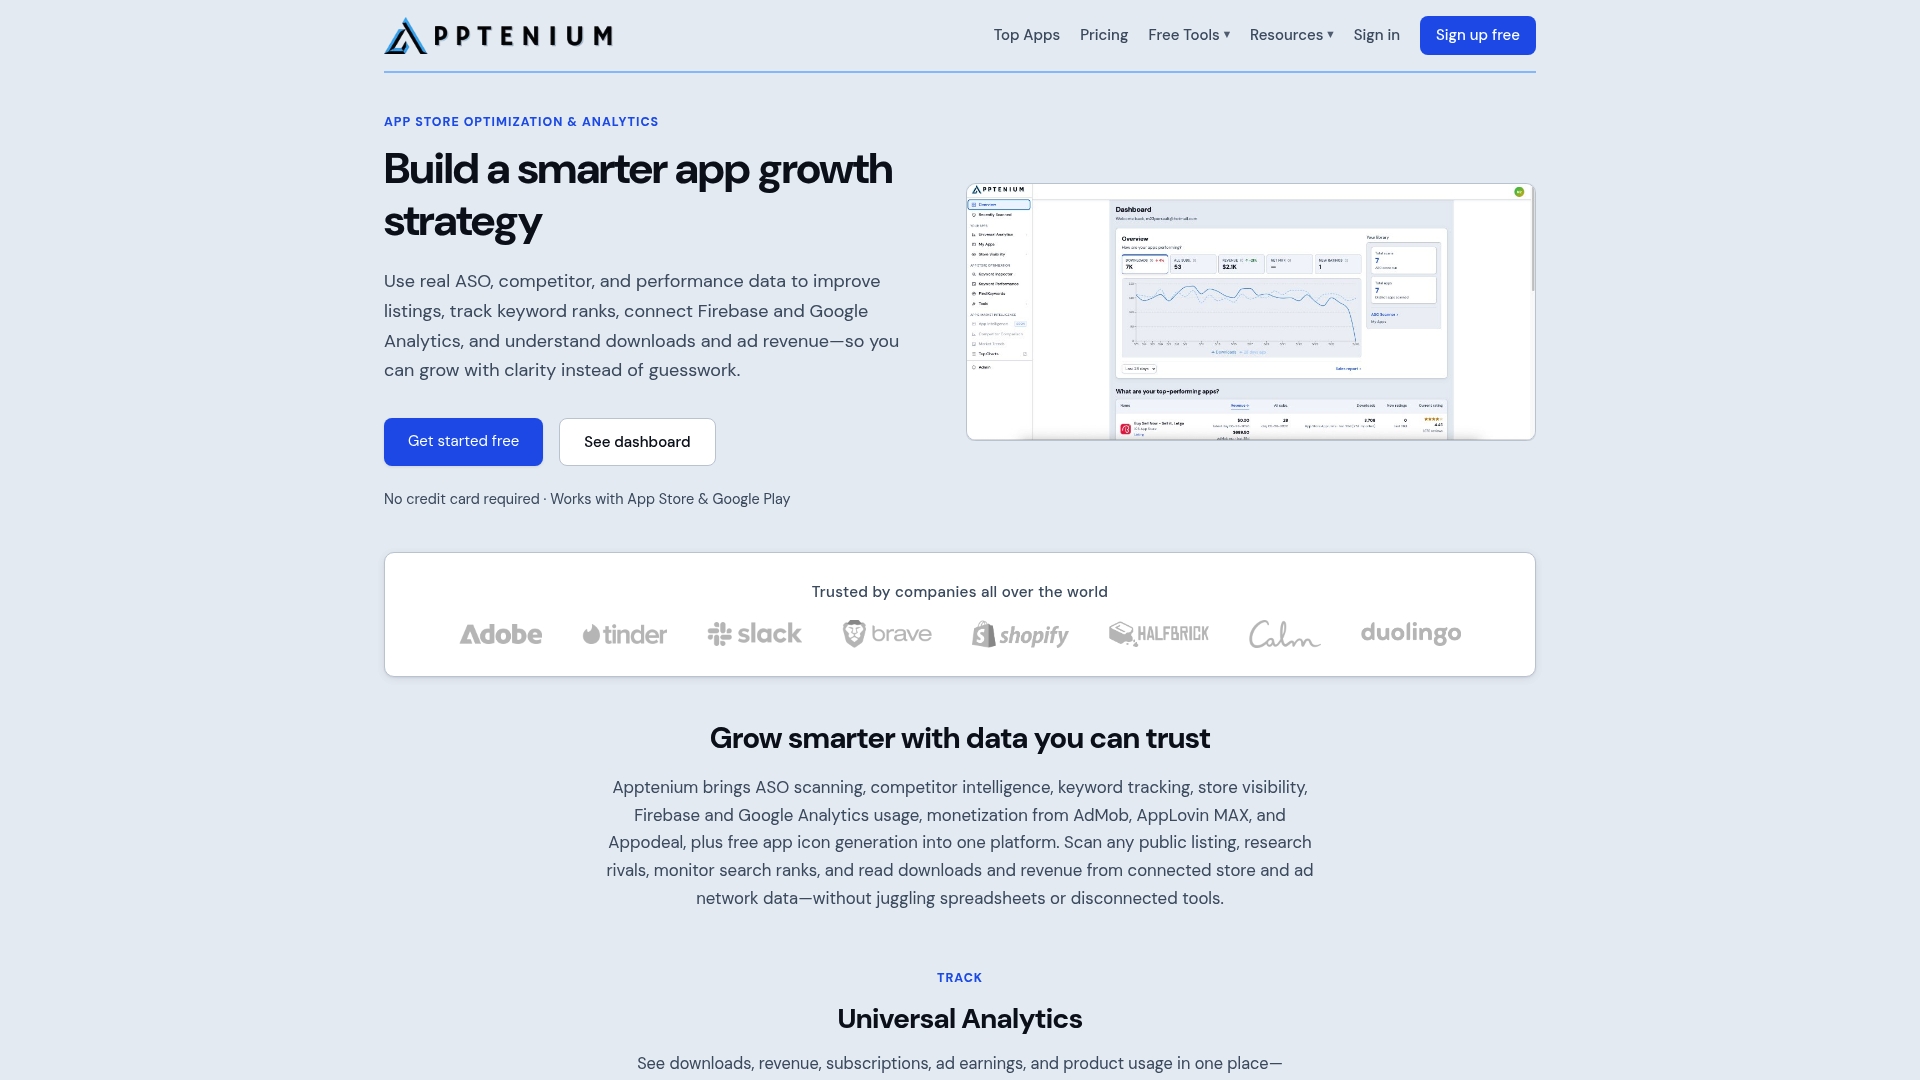
Forwarding postbacks, decoding parameters, and reconciling SKAN against store metrics is real engineering work, and plenty of teams end up building a custom pipeline just to answer one question: is this campaign actually working? Apptenium gives you that answer without the build, pulling Firebase, Google Analytics, and ad network data into one dashboard alongside keyword tracking, competitor intelligence, and AI-powered listing recommendations.
If your team already has engineering bandwidth and a mature data warehouse, building in-house still makes sense for highly custom attribution logic. For most app marketers who just need to see conversion-value trends next to store visibility and revenue, a consolidated platform gets you there faster and cheaper. Apptenium’s free ASO scanner lets you check your current listing performance today, and the full feature set shows exactly how the analytics side ties into ASO decisions once you’re ready to go further.
Where to Read the Technical Specs and Vendor Notes
For the exact mechanics behind everything covered here, go straight to the source: Apple’s SKAdNetwork developer documentation for the framework itself, Google’s SKAN reporting guide for Google Ads for platform-specific columns, and the Measurement Protocol guidance for Google Analytics ingestion. Your MMP’s help center will have vendor-specific notes on timing and dimension support worth checking before launch.
Sources
- How SKAdNetwork 4 works | Adjust Help Center
- SKAdNetwork | Apple Developer Documentation
- SKAdNetwork install and in-app event reporting for iOS App campaigns - Google Ads Help
FAQ
What is a SKAdNetwork?
SKAdNetwork is Apple’s built-in attribution framework for iOS apps that reports aggregated, privacy-preserving install and conversion data without exposing individual user identity, as described in Apple’s own developer documentation.
What does SKAN do?
SKAN measures which ad campaign likely drove an app install and reports a limited conversion value representing post-install behavior, using delayed postbacks rather than real-time device-level tracking.
What is a SKAN conversion?
A SKAN conversion is an in-app event, like a purchase or trial start, mapped to a numeric conversion value between 0 and 63 that gets sent back to the ad network in a postback, subject to Apple’s privacy thresholds and crowd anonymity tiers.
How can I report a concern about an app on the App Store?
That’s a separate process from SKAdNetwork reporting. Apple lets users flag concerns about a specific app directly through the app’s App Store listing page or through Apple’s official support channels, not through SKAN data.
Why does my SKAN report show mostly Null conversion values?
Nulls almost always mean the campaign didn’t clear Apple’s privacy threshold for that day or source app combination, not a tracking failure, and consolidating campaigns or increasing spend concentration can help clear that bar.