ROAS vs LTV for Apps: How to Use Both to Scale Profitably

ROAS vs LTV for Apps: How to Use Both to Scale Profitably
ROAS and LTV answer different questions. ROAS tells you how much revenue a campaign has returned so far for each dollar of ad spend. LTV tells you what a user is worth over the whole time they use your app. For an app, you need both: LTV sets the most you can afford to pay for an install, and cohort ROAS tells you whether a campaign is on track to reach that number. Keeping revenue, ads and listing data in one view makes the comparison far easier, which is what we built Apptenium to do.
TL;DR
- ROAS is attributed revenue divided by ad spend, always read at a day mark (D7, D30, D90). LTV is the revenue (ideally gross profit) a user or cohort generates over time.
- ROAS is a short-window campaign signal. LTV is the ceiling that decides how much you can pay per install.
- As a cohort ages, its ROAS climbs toward LTV divided by CPI. Your max CPI is LTV divided by your target ROAS.
- Compute both on cohorts, after app store fees, and by acquisition source. Averages across channels hide the campaigns that lose money.
- Pair paid ROAS with organic and listing performance so you see the full return on each install you buy.
Table of Contents
- What ROAS means for an app
- What LTV means for an app
- ROAS vs LTV: the differences that matter
- How the two connect: cohort ROAS climbs toward LTV ÷ CPI
- Why you cannot judge an app campaign on ROAS alone
- Why LTV alone is not enough either
- A practical workflow for using both
- Benchmarks: how to read them without being misled
- Do not forget organic installs
- Our perspective
- Put ROAS, LTV and listing performance in one view
- FAQ
- Sources
What ROAS means for an app
Return on ad spend (ROAS) is revenue attributed to a campaign divided by what you spent on it. A common app-marketing definition assesses it at day-N windows such as D7, D28 or D30. If you spend $1,000 and attribution credits $2,500 in revenue, ROAS is 2.5, or 250%.
Two details matter for apps:
- The day mark is part of the number. A D7 ROAS of 40% and a D30 ROAS of 40% describe very different situations. The first means a cohort is paying back fast. The second means it has stalled.
- Revenue is spread over time. Subscriptions renew, in-app purchases arrive late and ad revenue accrues daily. A campaign that looks poor at D3 may be fine at D90.
ROAS above 1 (100%) means a campaign has earned back its spend in revenue, but timing matters and ROAS alone says nothing about user loyalty. It also ignores margin. For a deeper look at how ROAS compares with a blended efficiency measure on the ecommerce side, this breakdown of ROAS versus MER shows why a single channel number can swing wildly from day to day.
What LTV means for an app
Lifetime value (LTV) is the cumulative revenue a user generates after installing your app. Google AdMob defines it to include in-app purchases after the store’s revenue share, ads revenue and subscriptions. Individual LTV is the sum of daily revenue from install day (D0) onward.
At cohort level, the same help page gives the formula: Dx LTV equals total revenue from D0 to Dx divided by the number of users who installed on D0. Its example: a user who earns $0.10, $1.50, $2.50 and $1.75 on D0 through D3 has a D3 LTV of $5.85.
That day mark again is the key. D3 LTV, D30 LTV and D365 LTV are different numbers for the same cohort. When someone says “our LTV is $12”, the first question is: over how many days, and for which users?

For subscription apps, a simple projection is average monthly revenue per user times gross margin, divided by monthly churn. Treat any projection as an estimate to be checked against real cohort curves as they mature.
ROAS vs LTV: the differences that matter
| ROAS | LTV | |
|---|---|---|
| Question answered | Did this campaign’s spend return revenue yet? | What is a user worth over their life in the app? |
| Formula | Attributed revenue ÷ ad spend | Cumulative cohort revenue (or gross profit) ÷ users in cohort |
| Time horizon | Days to a few weeks (D7, D30, D90) | Months to years, often projected |
| Depends on | Attribution window, spend, install quality | Retention, purchase rate, subscription renewals, ad revenue per user |
| Decision it drives | Pause, hold or scale a campaign | The maximum CPI and payback target you set |
| Main risk | Reading it too early or without a day mark | Projecting from a cohort that does not resemble new users |
One way to put it: LTV sets the ceiling for rational acquisition cost, and ROAS shows whether a specific campaign’s spend produced an acceptable return in its window. They are not rivals. They are the same return measured at two different points in time.
How the two connect: cohort ROAS climbs toward LTV ÷ CPI
Cost per install (CPI) is ad spend divided by installs. Cohort ROAS at day n equals revenue per install by day n divided by CPI. As the cohort ages, revenue per install grows toward LTV, so ROAS grows toward LTV divided by CPI.
That gives you the working rule: maximum CPI = LTV ÷ target ROAS.
A worked example
These figures are illustrative, not benchmarks.
- You pay a CPI of $2.00 on a campaign.
- At D7, the cohort has earned $0.50 per install. D7 ROAS is $0.50 ÷ $2.00 = 25%.
- At D90, revenue per install reaches $2.60. D90 ROAS is $2.60 ÷ $2.00 = 130%.
- Your D365 LTV, projected from older cohorts, is $4.50.
If you want a 150% return by D365, your maximum CPI is $4.50 ÷ 1.5 = $3.00. At $2.00, you have room to bid more. At $3.50, you are overpaying even if D7 looks healthy.
Why you cannot judge an app campaign on ROAS alone
Most subscription and gaming apps cannot reach positive ROAS on day one. Teams therefore target a payback period, commonly 3, 6 or 12 months, and an LTV/CAC ratio often of 3:1 or better. Short-window ROAS then serves as fast daily feedback, while LTV models built on first-week retention and early purchases keep spend aligned with profitability.
There are three typical ways ROAS alone misleads you:
- Cutting a slow payer. A campaign with weak D7 ROAS may bring subscribers who renew for a year. Pausing it throws away the best LTV.
- Scaling a fast payer. A campaign with strong D7 ROAS may bring purchasers who churn after one payment.
- Ignoring the store’s cut. LTV should be computed on gross profit and, for mobile apps, after the 15% to 30% app store fee. Revenue-based ROAS that skips this looks better than reality.
Why LTV alone is not enough either
LTV is slow. A D365 figure means waiting a year, and by then the market, your pricing and your creative have changed. Teams therefore use early ROAS as an indicator: it can be measured sooner, and historical cohort relationships are used to set early targets.
The same source gives an example: if historical D365 LTV is 20 times the D7 figure, then a 5% D7 ROAS target corresponds to 100% payback by D365, assuming that relationship holds. It will not hold everywhere. D7-to-lifetime multipliers are unreliable when cohorts have different retention and purchase-rate curves, particularly across media sources and campaign types.
So keep one multiplier per source, not one for the whole app. A Meta cohort, an Apple Search Ads cohort and a rewarded-video cohort rarely share a curve.
A practical workflow for using both
- Define LTV by cohort. Group users by install week and source. Track revenue per install at D7, D30, D90 and beyond. Include in-app purchases, subscriptions and ad revenue.
- Net out fees and refunds. For subscriptions, account for renewals, refunds and platform fees.
- Pick a payback target. Choose a window (for example, 6 or 12 months) and a target LTV:CAC ratio.
- Derive a CPI cap per source. Use LTV ÷ target ROAS, using each source’s own curve.
- Read ROAS at fixed day marks. Compare cohorts only once they reach D7, D30 or D90, and compare like with like.
- Scale what meets the target. Launch tests by cohort, scale campaigns that meet the target and watch diversification, as UA guidance recommends.
- Re-fit every month. As new cohorts mature, update your multipliers and caps.
If you need to turn these numbers into a report your team or clients can read at a glance, a one-page campaign performance report is a useful format to borrow.
On the CPI side, our guide to break-even CPI for app marketers walks through how to set the cap.
Benchmarks: how to read them without being misled
Benchmarks help you ask whether a number is plausible, not whether it is acceptable for your app.
- ROAS by day mark (subscription apps): one 2026 benchmark page lists D7 ROAS of 15% to 30%, D30 of 40% to 70% and D90 of 70% to 110%. It presents these as comparison values, not guaranteed payback outcomes.
- LTV:CAC for consumer apps: below 2:1 is poor, 2:1 to 3:1 average and above 3:1 good. The same source notes that a ratio much above 5:1 usually means you are underspending on growth.
- Mobile games: at Day 180, an LTV-to-CPI ratio below 1:1 is poor, 1:1 to 1.5:1 average and above 1.5:1 good, per the same tables.
A useful reading of the 5:1 point: a very high ratio is not a win. It suggests there are profitable installs you are not buying. Raise bids or widen targeting until the ratio comes down toward your target.
The People Also Ask question “is a 2.2 ROAS good?” has no universal answer for the same reason. At D7 on a subscription app it would be excellent. At D365 on a game with thin margin and a 30% store fee, it may barely cover costs. Always ask: which day mark, and what margin?

Do not forget organic installs
Paid campaigns often lift organic downloads too, and a keyword or listing improvement can lower your blended cost per install. If you judge paid ROAS in isolation, you undercount the return on spend, and you may overvalue paid installs if organic would have arrived anyway. Our guides on organic uplift measurement and how to track organic installs on iOS and Android show how to separate the two.
A stronger store listing also improves install conversion, which raises the value of every impression you buy. That is why LTV, ROAS and listing quality belong in the same conversation.
Our perspective
Most teams we talk to are not short of metrics. They are short of one place where the metrics sit side by side. ROAS lives in the ad dashboard, LTV in a spreadsheet, subscription revenue in the store console, ad monetization somewhere else, and the store listing in a fifth tab.
That fragmentation is what makes ROAS and LTV feel like competing numbers. Put downloads, revenue, subscriptions and ad monetization in the same view, connect Firebase and Google Analytics, and the relationship becomes obvious: ROAS is the early reading, LTV is the destination.
We built Apptenium to unify ASO scanning, competitor intelligence, keyword tracking and app performance reporting, with AI recommendations that give you copy-ready fixes from every scan. Better listings and better keyword rank lift organic installs, and that lowers your blended cost of acquiring a user. It is the cheapest lever on the LTV-to-CPI equation.
Start with a cohort view, set a payback target, and let the data tell you which campaigns deserve more budget.
Mike
Put ROAS, LTV and listing performance in one view
Apptenium brings app performance reporting (downloads, revenue, subscriptions and ad monetization) together with ASO scanning and keyword tracking, and it integrates data from Firebase, Google Analytics and ad networks. You can start on the Free plan, which includes a limited number of scans per month, and move to Pro at $9.99 per month for unlimited scans and premium features. See the plans and pricing.
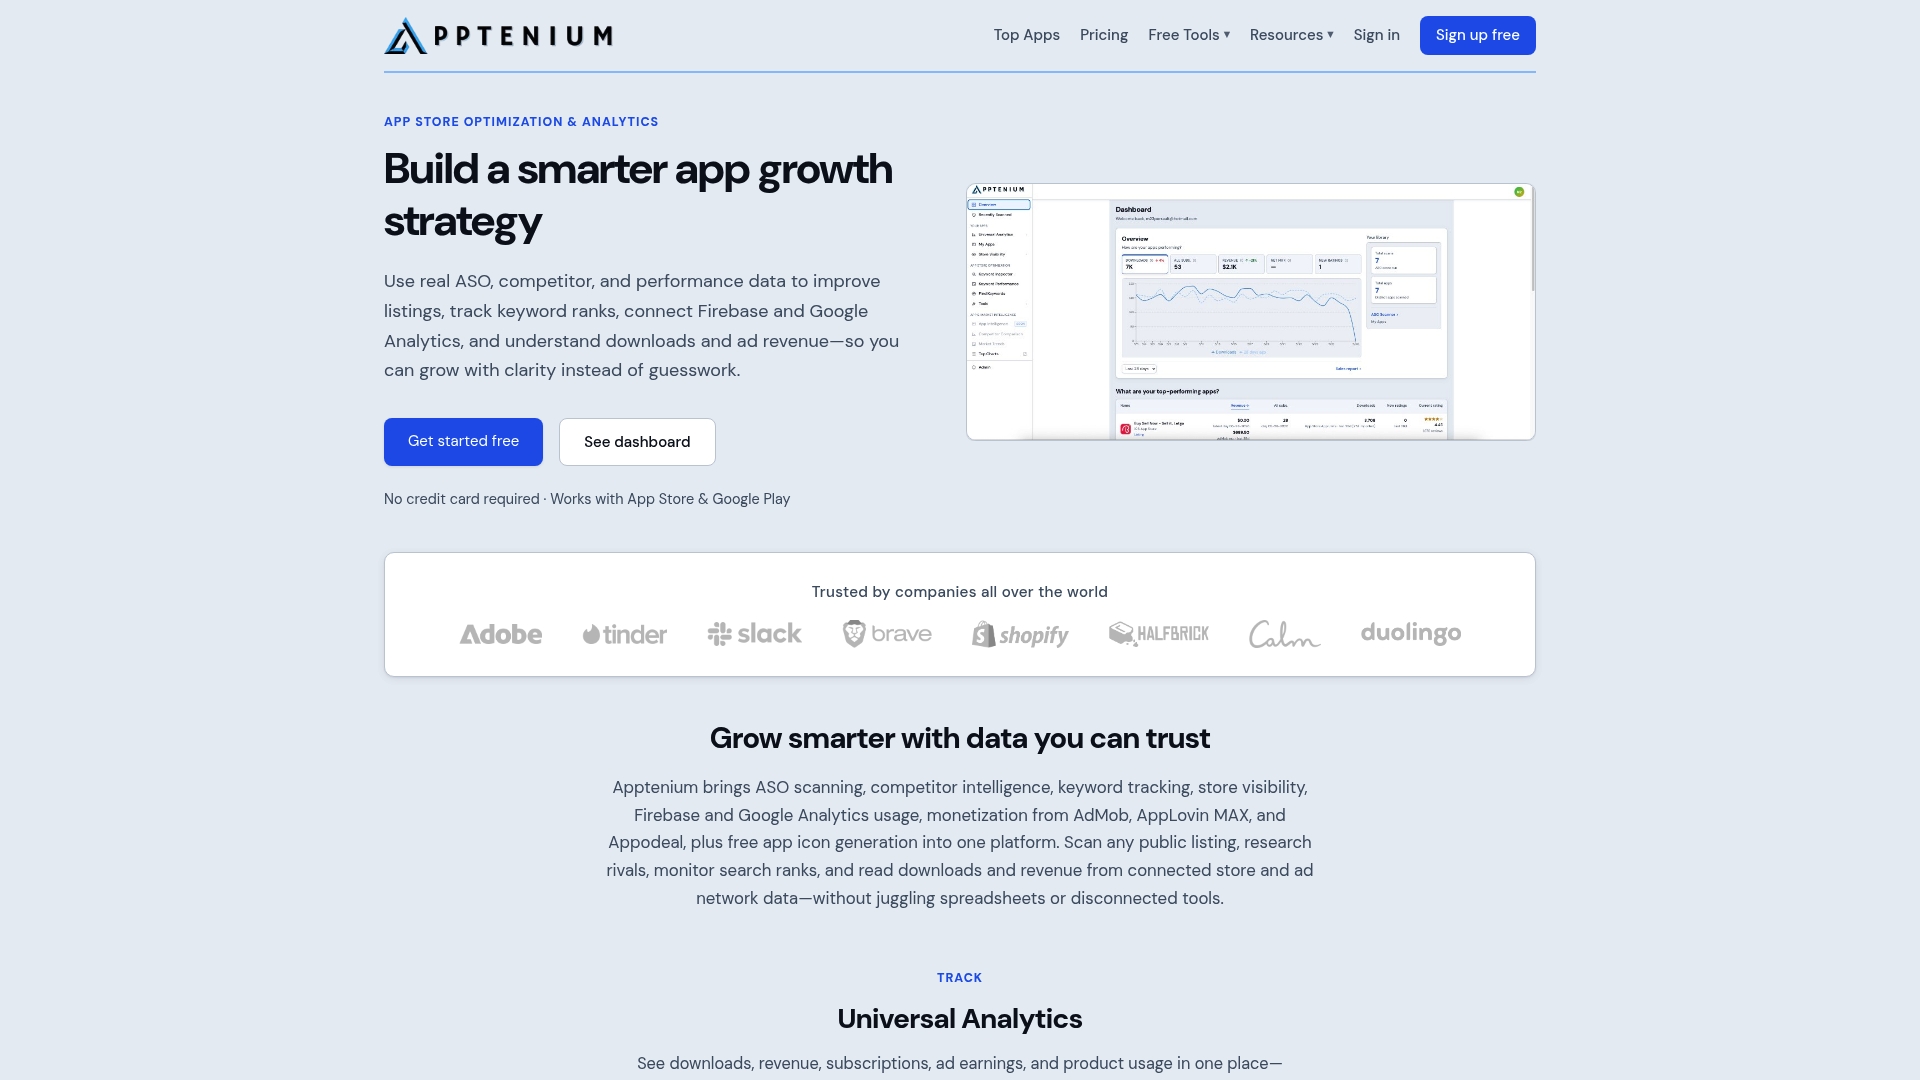
To see how the analytics side works, explore app analytics for downloads, revenue and ads. To make sure the report you share proves the impact of your listing work, follow our framework for measuring ASO impact.
FAQ
Is ROAS or LTV more important for an app?
Neither wins alone. LTV decides how much you can pay for an install, and ROAS tells you whether a campaign is heading toward that payback. Use LTV to set targets and cohort ROAS at D7, D30 and D90 to check progress.
What is a good ROAS for a mobile app?
It depends on the day mark, your margin and the store fee. One 2026 benchmark page puts subscription-app D30 ROAS at 40% to 70% and D90 at 70% to 110%, as comparison values rather than guarantees. Set your own target from your LTV and payback window.
What LTV:CAC ratio should I aim for?
For consumer apps, above 3:1 is generally treated as good, and under 2:1 as poor. Compute LTV on gross profit after store fees. A ratio far above 5:1 may mean you are underspending on growth.
How do I calculate max CPI from LTV and ROAS?
Divide your cohort LTV by your target ROAS. With a D365 LTV of $4.50 and a target ROAS of 150%, the cap is $3.00. Calculate it separately for each acquisition source, because retention and purchase curves differ.
Does ad revenue count in app LTV?
Yes. Google’s definition of LTV includes ads revenue and subscriptions as well as in-app purchases. For ad-monetized and hybrid apps, leaving it out understates what each user is worth.
Sources
- Understand lifetime value, Google AdMob Help
- User Acquisition for Mobile Games: The Complete Guide
- Gamelight Growth Guides: ROAS, LTV, Retention Rate
- App Marketing KPIs: The 7 Metrics That Matter in 2026
- How do you measure ROI when you advertise your app?
- LTV vs ROAS: First Purchase or Whole Relationship
- LTV vs ROAS: Lifetime Value and ROAS Compared
- Measuring ROAS: App Attribution and Analytics Guide
- LTV/CAC Ratio Benchmarks by Business Model
- Why LTV is essential for UA, and D7 ROAS should be retired
- Mobile App LTV: How to Calculate, Measure and Grow Lifetime Value
- Mobile App Marketing Benchmarks 2026
- ROAS vs MER for ecommerce budgets
- One-page campaign performance report