App Competitor Analysis: ASO Workflow for App Teams

A complete app competitor analysis produces four deliverables: a prioritized competitor pool, a profile template for each rival, a live monitoring dashboard, and a 30/60/90-day action plan. Start by identifying your competitive arena (direct, indirect, and disruptor apps), then collect store-level and ASO metrics for each competitor, build a profile, and set up alerts for meaningful changes.
Immediate steps to get started:
Identify several competitors using App Store and Google Play category rankings, keyword searches, and review cross-references
Collect ranking positions, estimated downloads, keyword share, review trends, and monetization signals for each
Build a one-page competitor profile per app using a consistent template (see Section 5)
Prioritize competitors by market share, keyword overlap, and feature parity
Set a weekly monitoring cadence with alerts for rank changes, review spikes, and creative refreshes
Pro Tip: Run your primary keyword in both the App Store and Google Play search bars and note the first five organic results. Those apps are your immediate competitive set, regardless of what you assumed going in.
Key Takeaways
A complete app competitor analysis requires a prioritized competitor pool, consistent profile templates, a live monitoring dashboard, and a clear cadence for acting on what you find.
PointDetailsBuild a focused competitor poolLimit active monitoring to 8–12 apps; score by keyword overlap, feature parity, and growth signals.Collect the right metricsTrack ranking, keyword share, review trends, monetization signals, and ad creatives for every competitor.Retention over installsASOMobile’s 2025 report signals retention is becoming the primary KPI; a rising rating count matters more than flat download estimates.Monitor on a cadenceRun daily rank checks, weekly keyword reviews, and monthly full profile refreshes to keep intelligence current.Use Apptenium for integrationApptenium connects ASO scanning, competitor intelligence, and Firebase/Google Analytics data into a unified dashboard.
Table of Contents
How do you define your competitive arena for app competitor analysis?
Where do you get each metric, and how do you integrate the sources?
How do you build a competitor profile and decide what to analyze first?
What marketing signals should you analyze in competitor apps?
How do you keep competitor tracking continuous and actionable?
An example workflow: Apptenium, Firebase, and Google Analytics working together
How do you use demographic and behavior data in competitor evaluation?
How do you compare competitors’ tech stacks and platform strategies?
How do you spot emerging trends and innovation directions in competitor apps?
Apptenium brings your competitor intelligence into one place
How do you define your competitive arena for app competitor analysis?
Most teams default to listing the apps they already know. That instinct misses the competitors that actually threaten growth.
Your competitive arena has three layers:
Direct competitors: Apps solving the same problem for the same audience. A budgeting app competes directly with another budgeting app targeting the same income bracket.
Indirect competitors: Apps solving the same problem differently or serving an adjacent audience. A spreadsheet app is an indirect competitor to a budgeting app because users substitute one for the other.
Disruptors: Apps entering from an adjacent category with a new delivery model. An AI-powered financial coach that bundles budgeting as a feature is a disruptor, not a direct rival, until it captures enough of your keyword share to become one.
How to build a prioritized competitor pool
Search your three to five primary keywords in both the App Store and Google Play. List every app in the top 10 organic results.
Check the “You might also like” and “Customers also bought” sections on competitor store pages.
Pull the top 20 apps in your category ranking. Flag any that share more than three keywords with your app.
Cross-reference with app market benchmarks to identify which competitors hold meaningful market share in your category.
Score each candidate on four criteria: keyword overlap, feature parity, user rating volume, and recent growth signals (rating count acceleration, featured placements, or press mentions).
Trim the list to 8–12 apps. That is a workable pool. More than 15 competitors dilutes your focus without adding proportional insight.
Pro Tip: Watch for non-obvious signals: a regional app launching in English for the first time, a localized review spike in a new language, or a sudden influencer-driven install surge in your category. These often precede a direct competitive move by 60–90 days.
What metrics should you collect for every competitor?
A reproducible analysis requires the same data fields for every competitor so profiles are directly comparable. Below is the full checklist, organized by category.
Store-level metrics
Current category rank and rank history (30-day and 90-day trend)
Featured placement history (editorial picks, curated collections)
App Store Connect and Google Play Console public metadata: title, subtitle, keyword field, short description
Distribution metrics
Estimated monthly downloads (triangulate from multiple sources; treat as directional, not precise)
Revenue estimates by platform and region
Top countries by install volume
User demographic signals where available (age range, device type, platform split)
ASO metrics
Title and subtitle keyword usage
Screenshot count, video presence, icon design iteration history
Engagement and product metrics
Review volume and rating trend (30-day, 90-day, all-time)
Estimated retention signals (rating recency patterns, session-length proxies)
Active user signals from third-party panel data
Monetization signals
Pricing model: free, freemium, paid upfront, or hybrid
In-app purchase catalog and price points
Subscription tiers and trial lengths
Ad monetization indicators (ad SDK presence, rewarded video patterns)
Key signal to watch: ASOMobile’s 2025 market report documents the rapid rise of AI apps and signals that retention, rather than installs, is becoming the primary KPI. If a competitor’s install estimates are flat but their rating count is accelerating, they are likely retaining users better than their download numbers suggest.
Warning: Estimated download figures from third-party tools carry significant sample bias. Use them to rank competitors relative to each other, not to project absolute market size. Store algorithm changes can also distort rank history; always check whether a rank shift coincides with a known algorithm update before drawing conclusions.
Where do you get each metric, and how do you integrate the sources?
Each metric type has a best-fit source. Mixing sources without understanding their reliability gaps leads to contradictory data and bad decisions.
Primary sources by metric type
App Store and Google Play public listings: title, subtitle, screenshots, video, rating count, rating average, category rank (visible to anyone; no account required)
App Store Connect / Google Play Console: your own app’s keyword performance, conversion rates, and funnel data; not accessible for competitors
Firebase and Google Analytics: in-app behavior, retention cohorts, session depth, and event funnels for your own app; use these as the benchmark against which you measure competitor signals
Google Ads Transparency Center: active ad creatives by advertiser and region; inspect competitor campaigns to reconstruct UA creative strategy and landing-page funnels
Third-party ASO platforms: keyword rank tracking, estimated downloads, review aggregation, and creative history; reliable for directional trends, less reliable for absolute figures
Adjust recommends including competitors’ digital ad footprints alongside app store signals, using tools like the Google Ads Transparency Center to inspect active ad campaigns and creatives. This is the step most teams skip, and it is where the most actionable UA intelligence lives.
Metric-to-source mapping
MetricPrimary sourceReliability noteCategory rankApp Store / Play public listingReal-time; check daily for volatile categoriesKeyword ownershipASO platform keyword trackerDirectional; verify top keywords manuallyEstimated downloadsThird-party panel dataTreat as relative ranking, not absolute volumeAd creativesGoogle Ads Transparency CenterLive data; limited to active campaignsReview themesApp store public reviewsComplete; scrape and tag manually or with toolingIn-app behaviorFirebase / Google AnalyticsYour app only; use as benchmarkRevenue estimatesBusiness of Apps + ASO platformsCross-reference both; wide confidence intervals
Pro Tip: Connect Firebase and Google Analytics to your ASO workflow by exporting your own retention and session data into the same dashboard where you track competitor rank and keyword share. The contrast between your behavioral data and competitors’ store signals is where the most useful gaps appear.
How do you build a competitor profile and decide what to analyze first?
A competitor profile is a one-page document that captures the most decision-relevant facts about a single app. Its value is consistency: every profile uses the same fields so your team can compare across competitors without re-reading raw data.
Competitor profile template fields
Summary: App name, developer, category, primary platform, and one-sentence positioning statement
Store metadata: Title, subtitle, short description, keyword field (Play), current rating, review count
Keywords owned: Top 10 keywords by rank, estimated traffic volume, overlap with your keyword set
Creative assets: Icon design, screenshot count and themes, video presence, last observed creative change
Reviews snapshot: Average rating, 30-day rating trend, top three positive themes, top three negative themes
Monetization: Pricing model, subscription tiers, IAP catalog, trial length, ad SDK presence
UA signals: Active ad creatives (from ad transparency tools), estimated paid channels, creative hooks observed
Integration points: Firebase SDK presence (if detectable), analytics stack signals, platform coverage (iOS/Android/web)
Prioritization matrix
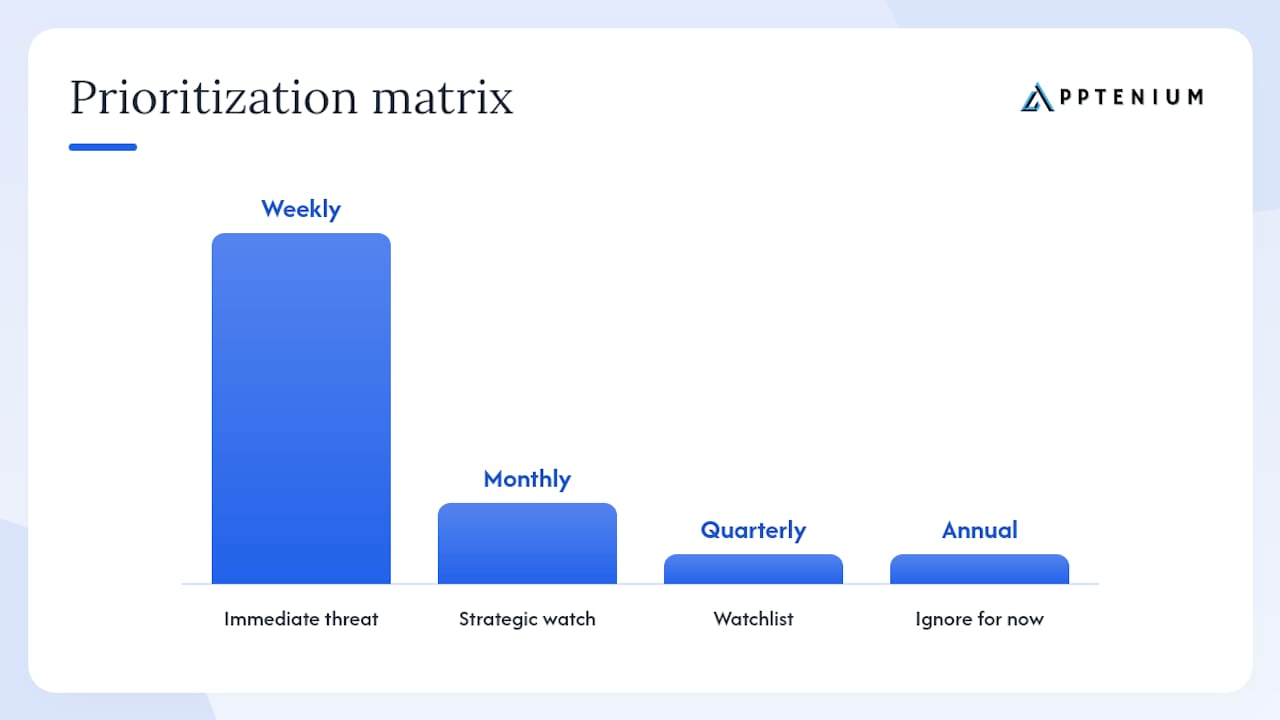
Not every competitor deserves the same depth of analysis. Use this two-axis matrix to allocate effort:
Priority tierCriteriaActionImmediate threatHigh keyword overlap + growing rating countFull profile + weekly monitoringStrategic watchStrong monetization + adjacent audienceMonthly deep profileWatchlistLow overlap but fast growthQuarterly scanIgnore for nowDeclining ratings + shrinking keyword shareAnnual check only
A quick scan (public store listing only) takes roughly 30 minutes per app. A deep profile (keywords, reviews, ad creatives, monetization) takes 2–4 hours. A full audit (all fields plus historical trend analysis) takes a full day. Assign quick scans to junior analysts and reserve deep profiles for your top three to five immediate threats.
Adjust’s competitive analysis framework confirms that a reproducible competitor profile and prioritized reporting are the essential outputs: a living document that informs ASO, UA, and product decisions simultaneously.
How do app store reviews reveal product opportunities?
Reviews are the most underused data source in mobile app market research. They are public, unfiltered, and updated daily. A structured review-mining process turns them into a ranked list of product opportunities.
Review-mining process
Export the most recent 500–1,000 reviews for each competitor using a review scraping tool or the store’s public API.
Clean the dataset: remove duplicate reviews, filter by language (start with English), and strip reviews under 10 words (too short to tag reliably).
Tag each review with one primary theme: bug report, UX friction, pricing complaint, feature request, localization issue, or positive reinforcement.
Count theme frequency and sort by volume. The top three negative themes are your highest-priority product opportunities.
Cross-reference the top feature requests against your own roadmap. Requests that appear in competitor reviews but are absent from your app are direct differentiation opportunities.
What to watch for
A sudden spike in one-star reviews mentioning the same bug often precedes a rating drop by 48–72 hours. If you see it in a competitor’s reviews, check whether the same issue exists in your app.
Pricing complaints concentrated in reviews from specific countries signal a localization or pricing-tier gap.
Feature requests that appear across multiple competitors’ reviews indicate a category-wide unmet need, not just a gap in one app.
AppFollow highlights that app store reviews, bug reports, pricing complaints, and feature requests are core inputs for competitor analysis and map directly to product opportunity discovery.
Sentiment analysis caveat: Automated sentiment scoring is a starting point, not a conclusion. A review tagged “positive” by a classifier can contain a buried feature complaint. Always read a sample of 50–100 reviews manually per competitor to calibrate your tagging model against real language patterns.
Deliverables from this process: a ranked opportunity list, a prioritized feature request backlog, and a churn-risk indicator list (recurring complaints that correlate with low ratings).
What marketing signals should you analyze in competitor apps?
Ad creatives, landing pages, and pricing experiments are where competitors reveal their conversion hypotheses. Analyzing them tells you what messaging is working in your category right now.
Ad creative checklist
Number of active creative variants (more variants = active testing)
Hook format: problem-led, benefit-led, social proof, or demo
Value proposition stated in the first three seconds of video or first line of static copy
Call-to-action pattern: “Free download,” “Try free,” “Start today,” or price-anchored
Localization: are creatives adapted by market or translated verbatim?
Platform: where are ads running (Search, Display, YouTube, Meta)?
Campaign reconstruction steps
Search the competitor’s app name in the Google Ads Transparency Center and filter by region (United States first).
Note every active creative format and the date each was first observed.
Click through any linked landing pages and document the headline, hero image, and primary CTA.
Map the landing page CTA to the store listing: does the messaging carry through, or does it break at the store page?
Record the gap between the ad’s value proposition and the store listing’s first screenshot. Messaging mismatches at this handoff are a common conversion leak.
Pricing and funnel signals
Trial length (3-day, 7-day, 14-day, 30-day) is visible in store listings and ad copy.
Freemium gates (which features are locked) are visible after installing the app.
Subscription price points are public in the store listing’s in-app purchase section.
Pro Tip: When a competitor refreshes their creative set entirely within a short window, it usually signals a failed test or a strategic pivot. Track creative refresh dates alongside their rating trend to infer whether the change was driven by performance or positioning.
Converting signals into experiments
List the top three messaging angles competitors are testing.
Identify which angle is absent from your current store listing.
Draft one screenshot or subtitle variant that tests that angle.
Prioritize by estimated keyword traffic impact and run the test for a minimum of two weeks.
How do you keep competitor tracking continuous and actionable?
A one-time analysis goes stale within weeks. The goal is a monitoring system that surfaces meaningful changes without requiring daily manual checks.
Recommended monitoring cadence
Daily: Category rank for your top five immediate threats; new review alerts for one-star spikes
Weekly: Keyword rank changes (top 50 keywords); creative refresh detection; rating trend for all tracked competitors
Monthly: Full profile refresh for immediate threats; estimated download and revenue trend review; ad creative audit
Dashboard essentials
WidgetMetricAlert thresholdRank trackerCategory rank for top 5 competitorsDrop or gain of 5+ positions in 7 daysReview monitor7-day rolling average ratingDrop in star rating or 30+ new 1-star reviewsKeyword share% of tracked keywords in top 10Competitor gains 3+ new top-10 keywordsCreative trackerDate of last creative changeAny change detectedRevenue estimateMonthly revenue trend20%+ month-over-month change
Alert routing
Severity 1 (act within 24 hours): Competitor drops 10+ category rank positions or receives a coordinated review spike. Check whether the cause is a bug, a policy violation, or a PR event before reacting.
Severity 2 (act within 1 week): Competitor launches a new keyword cluster that overlaps with your top 20 keywords. Update your ASO response.
Severity 3 (note and monitor): Competitor refreshes creatives or adjusts pricing. Log the change and revisit in 30 days.
Retention is the new install: ASOMobile’s 2025 market report signals that retention, not installs, is becoming the primary KPI going into 2026. Add a retention proxy metric to your dashboard: watch for competitors whose rating count accelerates without a corresponding install spike, which suggests strong re-engagement or referral loops.
What mistakes should you avoid in competitor analysis?
The most expensive mistakes in analyzing app competitors are not data gaps. They are misinterpretations that send teams in the wrong direction.
Common mistakes
Over-relying on estimated downloads: Third-party download estimates carry wide confidence intervals. Using them to make absolute market-share claims leads to overconfident roadmap decisions. Use them only for relative ranking.
Conflating installs with retention: A competitor with high estimated installs and a declining rating trend is likely churning users faster than they acquire them. That is a weak position, not a strong one.
Ignoring localization signals: A competitor adding Japanese or Portuguese screenshots is signaling a market expansion move. Most teams miss this because they only read English reviews.
Treating a one-time analysis as current: App store rankings, keyword ownership, and creative strategies change monthly. A competitor profile built six months ago is unreliable.
Analyzing too many competitors: Tracking 30 apps produces noise, not insight. Keep your active monitoring list to 8–12 apps.
Red-flag checklist
Sudden rating drop of 0.3+ stars within 7 days: investigate for a bug release or policy action
Coordinated review spike (many reviews in 24 hours with similar phrasing): possible review manipulation; do not treat as organic signal
Unexplained rank drop without a rating change: possible store algorithm update or policy enforcement
Inconsistent telemetry: estimated downloads rising while rating count is flat suggests panel data error, not real growth
Pro Tip: Before acting on any suspicious signal, cross-reference it against two independent sources. A rank drop that appears in one ASO tool but not another is likely a data artifact. A rank drop confirmed by the store’s own public listing is real.
An example workflow: Apptenium, Firebase, and Google Analytics working together
This workflow shows how to run a complete competitor analysis cycle using an integrated toolset, from discovery through reporting.
Step-by-step workflow
Competitor discovery (Day 1): Search your top five keywords in the App Store and Google Play. Use Apptenium’s competitor intelligence to pull category rank history and keyword overlap for each candidate. Shortlist 8–12 apps.
Profile build (Days 2–5): For each shortlisted competitor, complete the profile template (Section 5). Pull store metadata, keyword ownership, and review themes from Apptenium’s ASO scanner. Check the Google Ads Transparency Center for active creatives.
Benchmark against your own data (Days 6–7): Export your retention cohorts and session depth from Firebase and Google Analytics. Compare your engagement benchmarks against competitor review signals and estimated retention proxies.
Dashboard setup (Day 8): Configure your monitoring dashboard with rank, review, keyword share, and creative widgets. Set alert thresholds from the cadence table in Section 8.
First report (Day 10): Produce a one-page summary per top-three competitor: positioning, keyword gaps, review opportunities, and one recommended ASO experiment.
Ongoing cadence: Weekly keyword and rank check; monthly full profile refresh; quarterly strategic review with product and marketing leads.
Integration checklist
Firebase exports: retention cohorts (Day 1, Day 7, Day 30), session depth, event completion rates
Google Analytics exports: acquisition source breakdown, engagement rate by channel, conversion funnel drop-off points
Apptenium inputs: competitor keyword rank, ASO scan results, AI-powered listing recommendations, unified dashboard
Time estimates per stage
Competitor discovery: 2–3 hours
Profile build (8 competitors): 1–2 days
Dashboard setup: 3–4 hours
First report: 2–3 hours
Ongoing weekly monitoring: 1–2 hours per week
Apptenium integrates ASO scanning, competitor intelligence, keyword tracking, and data from Firebase and Google Analytics to deliver AI-powered listing recommendations and unified dashboards, reducing the manual effort of the integration checklist above.
How do you use demographic and behavior data in competitor evaluation?
Store-level metrics tell you what competitors are doing. Demographic and behavioral data tells you who they are doing it for and whether it is working.
For your own app, Firebase and Google Analytics provide the behavioral baseline: age range, device type, geographic distribution, session frequency, and feature adoption rates. Use these as the lens through which you interpret competitor signals.
For competitors, demographic data is indirect. App store category rankings skew toward specific device types (iPad-heavy categories often index toward older, higher-income users). Review language patterns reveal geographic concentration. Ad creative targeting signals (visible in ad transparency tools) often indicate the demographic the competitor is actively acquiring.
When a competitor’s ad creatives shift from broad lifestyle imagery to specific professional or age-group imagery, they are signaling a demographic pivot. Cross-reference that shift with their keyword changes: if they are simultaneously adding professional-context keywords, the pivot is deliberate and worth tracking closely.
Behavioral signals from review text are underrated. Reviews that mention specific use contexts (“I use this every morning before work,” “great for my college budget”) reveal behavioral patterns that demographic data alone cannot surface. Tag these context signals during your review-mining process and map them to your own user personas.
How do you compare competitors’ tech stacks and platform strategies?
Platform strategy is a competitive signal most ASO-focused teams overlook. Whether a competitor is iOS-first, Android-first, or cross-platform affects their keyword strategy, monetization approach, and user acquisition priorities.
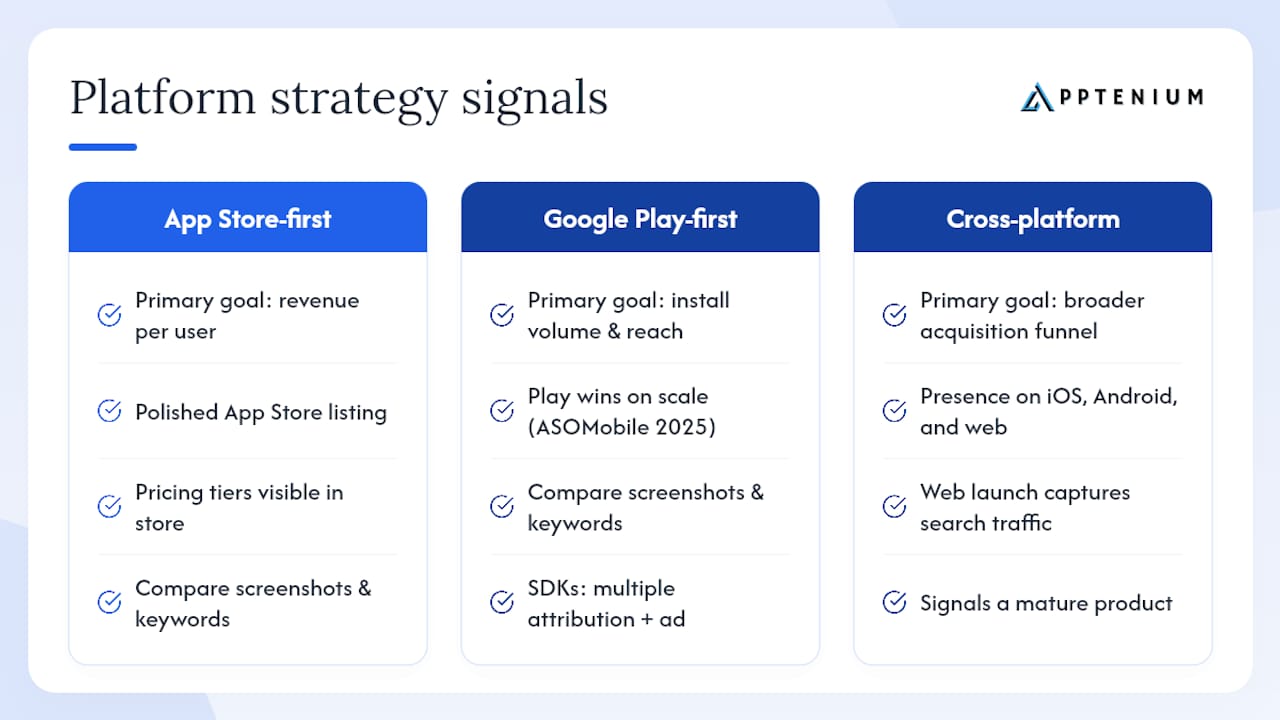
ASOMobile’s 2025 market report documents a clear platform asymmetry: Google Play wins on scale, the App Store wins on monetization. A competitor that is App Store-first is likely optimizing for revenue per user. A competitor that is Google Play-first is likely optimizing for install volume and geographic reach.
To assess a competitor’s platform strategy, compare their App Store and Google Play listings side by side. Differences in screenshots, keyword fields, and pricing tiers reveal which platform they treat as primary. A competitor with a polished App Store listing and a minimal Google Play presence is signaling where their revenue comes from.
Tech stack signals are harder to read but not invisible. SDK detection tools can identify analytics, attribution, and monetization SDKs embedded in a competitor’s app. An app running multiple attribution SDKs alongside a major ad network SDK is investing heavily in paid UA. An app with a minimal SDK footprint is likely relying on organic growth or a single owned channel.
Cross-platform presence (iOS, Android, and web) signals a mature product with a broader acquisition funnel. A competitor that recently launched a web version of their mobile app is often trying to capture search-intent traffic that the app stores cannot reach.
How do you spot emerging trends and innovation directions in competitor apps?
The earliest signal of a competitor’s innovation direction is usually not a product launch. It is a pattern of small changes: new keywords added to their metadata, a screenshot that highlights a feature they did not previously promote, or a job posting for a specific engineering role.
Watch for these leading indicators:
Metadata changes: A competitor adding AI-related keywords or updating their subtitle to include a new feature name is signaling a product direction before the feature ships widely.
Screenshot evolution: New screenshots that highlight a previously unlisted feature indicate a recent build or a conversion test on a new value proposition.
Review request timing: A competitor that adds an in-app review prompt after a specific event (completing a task, reaching a milestone) is testing a new retention mechanic.
Category shifts: An app that moves from one subcategory to another in the App Store is repositioning for a different keyword cluster and audience.
AI feature signals: Given the rapid rise of AI apps documented in ASOMobile’s 2025 report, any competitor adding “AI,” “smart,” or model-specific language to their metadata deserves immediate attention.
The most valuable competitive intelligence is not what competitors have shipped. It is what they are testing. A screenshot A/B test visible in the store (some users see version A, others see version B) tells you exactly what conversion hypothesis they are running. If you can identify the test, you can run a parallel experiment on your own listing before they publish results.
Coursera recommends using LLMs like ChatGPT to generate competitor lists, summarize review themes, and draft hypotheses, but always verify outputs against primary data sources. LLMs are useful for pattern synthesis across large review sets; they are not reliable for specific ranking data or download estimates.
What most teams get wrong about competitor analysis
The conventional wisdom says to track your top five competitors closely and update your analysis quarterly. That cadence made sense when app stores moved slowly. It does not hold in a category where a new AI-powered entrant can go from zero to top-10 in six weeks.
The more useful frame is asymmetric attention: spend 80% of your monitoring effort on the two or three competitors who overlap most with your keyword set and user base, and spend 20% on a broader watchlist that catches disruptors early. Most teams invert this ratio, spreading effort evenly across a long list and missing the signals that actually matter.
There is also a tendency to treat competitor analysis as a research project rather than an operational input. The analysis only creates value when it changes a decision: a keyword you add, a screenshot you test, a feature you prioritize, or a pricing experiment you run. If your competitor profiles are sitting in a shared folder and not feeding your sprint planning or ASO calendar, the process is producing documentation, not results.
The gap analysis framing from Adjust’s competitive analysis guide captures this well: the most valuable plays identify what competitors are not doing. A category where every top app uses the same screenshot format and the same value proposition is a category waiting for someone to test something different.
Apptenium brings your competitor intelligence into one place
Running a full competitor analysis across store data, keyword tracking, ad creatives, and behavioral benchmarks means juggling five or six separate tools. Most teams either skip the integration step or spend more time moving data than acting on it.
Apptenium consolidates the core workflow: ASO scanning, competitor keyword tracking, rank monitoring, and AI-powered listing recommendations in a single platform. It connects directly with Firebase and Google Analytics, so your behavioral benchmarks and competitor store signals live in the same dashboard instead of separate exports.
The free tier gives you enough to run your first competitor scan and keyword gap analysis. The paid tier removes scan limits and unlocks the full competitor intelligence and monitoring suite. If you are running the workflow described in this article and want to cut the manual integration work, start your first scan on Apptenium and see the competitor and keyword data in one view.
Sources
Short descriptions for each source so you can start pulling data immediately:
FAQ
How do you run an app competitor analysis?
Identify 8–12 competitors using keyword searches and category rankings, collect store-level and ASO metrics for each, build a consistent profile template, and set up a monitoring dashboard with weekly and monthly review cadences.
What are the 4 P’s of competitor analysis?
The 4 P’s (Product, Price, Place, Promotion) apply to app analysis as: the app’s feature set and UX, its pricing and monetization model, its platform and geographic distribution, and its UA and creative strategy. Each maps to a distinct data source in your competitor profile.
What is the best tool for app competitor analysis?
Apptenium covers the core workflow: ASO scanning, competitor keyword tracking, rank monitoring, and integration with Firebase and Google Analytics for behavioral benchmarking. For ad creative reconnaissance, the Google Ads Transparency Center is the most reliable free source.
How do you use ChatGPT for competitor analysis?
Coursera recommends using ChatGPT to generate initial competitor lists, summarize large review datasets, and draft test hypotheses. Always verify outputs against primary sources like store listings and ad transparency tools before acting on them.