App Store Listing Optimization: What to Fix First in 2026
App Store Listing Optimization: What to Fix First in 2026
Fix your metadata to win visibility. Fix your icon and first screenshots to win conversions. Do those two things before anything else, because they cover the two levers that actually move installs: whether the store shows your app and whether people tap it once they see it.
Here’s your 24 to 72 hour checklist:
- Add your primary keyword to the title. Both the App Store and Google Play weight title text heavily in search relevance, so a title with zero keyword signal is leaving visibility on the table.
- Refresh your icon or first screenshot. These two assets do more conversion work than your entire description combined.
- Queue an A/B test. Use Apple’s Product Page Optimization or Google Play’s Store Listing Experiments to validate the creative change instead of guessing.
Metadata changes typically show up in ranking within 7 to 14 days as the algorithm re-indexes your listing and gathers new behavioral data. Creative changes work differently: a better icon or screenshot lifts conversion the moment it goes live, and that lift compounds into better ranking over the following weeks as the store rewards higher tap-to-install rates with more impressions.
Key Takeaways
App store listing optimization works when metadata drives visibility, creative assets drive conversion, and both are tested and measured on a repeating 90-day cycle.
| Point | Details |
|---|---|
| Fix metadata first if unranked | Title, subtitle, and keyword field placement determine whether your app appears in search at all. |
| Icon and first screenshot decide conversion | Most install decisions happen within seven seconds of viewing your listing. |
| Test one variable at a time | Sequence icon, then screenshots, then video, using Apple PPO or Google Play experiments. |
| Track eight core KPIs | Impressions, conversion rate, retention, and crash rate together reveal what’s actually working. |
| Run ASO as a quarterly cycle | Audit, implement, test, and iterate every 90 days rather than treating optimization as a one-time task. |
| Use Apptenium for the audit-to-test loop | The free ASO Scanner surfaces prioritized fixes, with the SMB plan adding continuous tracking and AI recommendations. |
Table of Contents
- What Is App Store Listing Optimization?
- How Do iOS and Google Play Metadata Rules Differ?
- How Do You Research and Place Keywords That Actually Convert?
- What Makes an Icon and Screenshots Convert?
- How Do You Run and Read a Product Page Test?
- What KPIs Should You Track for ASO?
- What Does a 90-Day ASO Workflow Look Like?
- How Apptenium Fits Into This Workflow
- How Do You Write a Description That Actually Converts?
- Sources
- FAQ
What Is App Store Listing Optimization?
App store listing optimization is the practice of managing three interlocking signal categories: visibility, conversion, and durability. Most developers only work on one of these at a time, usually visibility, and wonder why installs stay flat. The real work is treating all three as a single system.
Visibility comes from metadata: your title, subtitle, keyword field, and description. These are the inputs the store’s search algorithm reads to decide whether your app shows up for a given query.
Conversion comes from your creative assets: icon, screenshots, preview video, and ratings. These decide whether someone who sees your listing actually taps install.
Durability comes from what happens after the install: retention, crash rate, and review velocity. Weak durability quietly undermines the other two, because both Apple and Google factor post-install behavior into long-term ranking.
Here’s the feedback loop that makes this compound:
- Better metadata gets your app in front of more relevant searchers.
- Better creative converts more of those searchers into installs.
- Higher conversion rates signal quality to the ranking algorithm.
- The algorithm rewards that signal with more impressions.
- More impressions plus steady retention produce more reviews, which reinforces step 1.
A modest icon or screenshot win doesn’t just lift one week’s numbers. Because the ranking algorithm treats conversion rate as an input, a durable creative win can multiply lifetime organic installs rather than produce a one-time bump.
When should you default to metadata work versus creative work? If your app ranks outside the top 10 for its core terms, fix metadata first. There’s no conversion rate worth optimizing if nobody sees the listing. If you rank well but your conversion rate lags category benchmarks, shift to creative. Chasing both simultaneously usually means neither gets done properly.
How Do iOS and Google Play Metadata Rules Differ?
The two platforms enforce different field limits and index different content, and treating them identically wastes half your keyword strategy. Apple and Google built separate search systems, and each rewards a distinct set of habits.
On iOS, your title caps at 30 characters and carries the heaviest keyword weight of any field. Your subtitle also caps at 30 characters and functions as a secondary keyword slot, visible right under the title in search results. The dedicated keywords field allows 100 characters, isn’t shown to users, and should be packed with comma-separated terms, no spaces needed after commas, since Apple’s system parses them regardless. Your promotional text (170 characters) is not indexed at all. It exists purely for marketing copy you want to change without triggering a new app review. And since 2025, Apple indexes text inside your screenshots via OCR, so screenshot captions have quietly become a discovery channel, not just a conversion one.
Google Play works differently. Your title also caps at 30 characters, but your short description (80 characters) is both visible to users and heavily indexed, unlike Apple’s promotional text. Your full description runs up to 4,000 characters and gets meaningfully stronger indexing weight than Apple’s description field, which barely factors into iOS search at all. Your feature graphic, a Play Store exclusive, sits at the top of your listing and often gets tested alongside your icon.
The testing tools diverge too. Apple’s Product Page Optimization lets you run up to three alternate treatments against your baseline and supports custom product pages for paid acquisition campaigns tied to specific ad creative. Google’s Store Listing Experiments work similarly but let you test more listing elements simultaneously, including the feature graphic. If you’re running paid UA alongside organic ASO, custom product pages on iOS deserve their own testing cadence separate from your default listing.
How Do You Research and Place Keywords That Actually Convert?
Start with four sources: App Store autocomplete suggestions, Apple Search Ads keyword volume estimates, Google Play Console’s search terms report, and manual mining of category-adjacent apps’ visible metadata. None of these require expensive tools to access, though aggregating them by hand across dozens of terms gets tedious fast.
Score every candidate keyword against four factors: relevance to your core function, estimated search volume, ranking difficulty (how entrenched the current top results are), and buyer intent. A keyword with huge volume but low relevance drags in the wrong install cohort, and that shows up later as poor retention. A niche term with modest volume but high intent often converts better than a head term ever will.
Build a working basket of 10 to 20 active keywords, the range most operator playbooks converge on for apps outside the largest categories. Trying to rank for 50 terms at once spreads your metadata too thin to move any of them meaningfully.
Placement rules differ by field:
- Title structure: lead with your brand name, then your single highest-value keyword phrase, separated by a colon or dash. “Ledger: Budget & Expense Tracker” beats a title stuffed with five loosely related terms.
- Subtitle (iOS) or short description (Google Play): use your second and third priority keywords here in natural phrasing, since Google indexes this field strongly and Apple surfaces it directly in search results.
- Keywords field (iOS only): list remaining terms without repeating anything already in your title or subtitle. Apple’s algorithm already credits those fields, so duplicating wastes character budget.
- Screenshot captions: work keywords into captions naturally, since OCR indexing means these captions do double duty as both conversion copy and a discovery signal.
Pro Tip: Run your current title and description through a keyword density check before you touch anything else. You’ll often find you’re accidentally repeating one term four times while ignoring a higher-value synonym entirely. Apptenium’s keyword density tool surfaces this in seconds.
Localization isn’t a translation task, it’s a research task. Prioritize your top 3 to 5 territories by install volume or revenue, then research keywords natively in each language rather than machine-translating your English basket. A term that ranks well in the US App Store often has a completely different, non-obvious equivalent in the Japanese or German store, and your screenshot captions and short descriptions need that same territory-specific treatment.
What Makes an Icon and Screenshots Convert?
You have about seven seconds before someone decides to install or move on, and your icon, first screenshot, and headline caption do almost all of that persuasive work.
Icon design comes down to legibility under pressure. Your icon renders at roughly 29 points on a home screen, smaller than most designers ever test at. Use a single simple glyph or character rather than a busy scene, push contrast hard so it doesn’t blend into a crowded home screen, and prepare at least two genuinely different directions (not just color variants) before you commit to a Product Page Optimization test.
Screenshots follow a different logic entirely:
- Put your core value proposition in the top left of your first screenshot. That’s where eyes land first, and it’s the only screenshot most browsers actually study.
- Keep captions under seven words. Longer captions get skimmed or ignored entirely.
- Include social proof, a rating, a download count, a press mention, somewhere in your first two screenshots. Prominent social proof can lift conversion substantially, with some case studies reporting substantial gains when it’s placed well.
- Write captions with OCR in mind. Since Apple now indexes screenshot text, a caption that’s both persuasive to a human and keyword-relevant does double duty.
Preview video, when you use one, should run 15 to 30 seconds and open with something that grabs attention in the first three seconds, not a logo animation or slow fade-in. Show your core user flow, the two or three things people actually do in your app, rather than a highlight reel of every feature. Localize the video’s on-screen text and voiceover for your top territories instead of assuming your English cut travels.
The most common creative mistake isn’t bad design, it’s testing too many variables at once. A team swaps the icon, reorders the screenshots, and rewrites the captions in the same release, then has no idea which change drove the result. The second most common mistake is designing for a laptop screen and never checking how the icon actually looks at real device size.
How Do You Run and Read a Product Page Test?
Sequence your tests by expected impact, not by what’s easiest to produce. Icon tests typically move conversion the most, so run those first. Lead screenshot tests come next, then preview video, since video takes the most effort to produce for the smallest typical lift.
Change exactly one major variable per treatment arm. If you swap the icon and reorder screenshots in the same test, a winning result tells you nothing about which change actually worked.
- Define your sample size and duration before launch. Apple’s Product Page Optimization needs a minimum download threshold before it surfaces any results, and tests can run up to 90 days.
- Set your confidence bar and stick to it. Apple’s system uses Bayesian methods and credible intervals rather than classic p-values, and it labels results as Performing Better, Performing Worse, or Likely to be Inconclusive.
- Resist checking daily and reacting to noise. Early results swing wildly before your sample stabilizes; peeking early and stopping tests prematurely is one of the most reliable ways to declare a false winner.
- Read the conversion card correctly. A treatment “performing better” with a wide credible interval is a weaker signal than a narrower one with the same headline lift.
- Act on winners immediately, but keep testing. Roll a winning treatment into your default listing, then queue the next variable in your sequence rather than treating the win as a finish line.
| Test element | Typical sequence position | What to change | What to hold constant |
|---|---|---|---|
| Icon | First | Glyph, color, contrast | Screenshots, video, captions |
| First 1–2 screenshots | Second | Layout, caption, social proof | Icon, remaining screenshots |
| Preview video | Third | Opening 3 seconds, flow shown | Icon, screenshots |
If a result comes back “Likely to be Inconclusive,” don’t force a decision. Extend the test window if traffic allows, or accept that the variable you tested doesn’t move conversion enough to matter, and move to the next item in your sequence.
What KPIs Should You Track for ASO?
Own a dashboard with eight numbers, no more, or you’ll drown in metrics that don’t actually tell you whether a change worked.
- Impressions: how often your listing appears in search or browse.
- Tap-through rate: impressions that convert to a product page view.
- Tap-to-install (conversion rate): product page views that convert to installs, your core creative metric.
- Download velocity: the rate of installs over time, useful for spotting momentum shifts.
- D1/D7 retention: the percentage of users still active one and seven days after install.
- Crash rate and uninstall rate: quality signals that both platforms weigh in ranking.
- Review velocity and rating trend: how fast new reviews arrive and whether average rating is rising or falling.
Segment every one of these by country, device type, custom product page, and traffic source before drawing conclusions. A conversion rate that looks flat in aggregate might be climbing in your top territory and sinking in a smaller one that’s dragging the average down.
Early-funnel metrics (impressions, tap-through, conversion) tell you whether your metadata and creative are working. Late-funnel metrics (retention, crash rate, review trend) tell you whether the app itself is delivering. The trap is attributing a retention drop to your ASO changes when the real cause is a buggy release that shipped the same week. Cross-reference your KPI dashboard against your release notes before assigning credit or blame.
Apple’s App Analytics, Google Play Console, Firebase, and Google Analytics each own a piece of this picture, and none of them shows the whole thing alone. Pulling conversion data from one tool and revenue data from another, manually, every week, is exactly the fragmentation that turns a 20 minute check into a half day chore; using Osellpa’s clear profit tracking and growth tools for Amazon sellers can streamline your data integration and tracking.
What Does a 90-Day ASO Workflow Look Like?
Treat ASO as a quarterly cycle, not a one-time project, because durable gains come from repeated iteration, not a single overhaul.
- Weeks 1 to 2, audit. Record your baseline: current keyword ranks, impressions, conversion rate, category rank, and any glaring issues (an outdated screenshot, a broken keyword field, a stale description).
- Weeks 3 to 4, implement and schedule. Ship your metadata updates and one creative refresh. Submit your first Product Page Optimization or Play experiment so it’s collecting traffic while you move to the next phase.
- Weeks 5 to 12, run, monitor, iterate. Let tests reach their sample-size threshold, review results honestly, roll winners into your default listing, and localize your top territories with the winning creative direction.
| Role | Week 1–2 | Week 3–4 | Week 5–12 |
|---|---|---|---|
| Marketer/ASO lead | Runs audit, sets baseline | Writes new metadata, schedules test | Monitors KPIs, localizes winners |
| Designer | Reviews current creative | Produces icon/screenshot variants | Iterates on next test in sequence |
| Product/engineering | Flags known bugs affecting reviews | Fixes crash issues before test launch | Ships fixes that protect retention |
Pro Tip: If your app gets under 1,000 daily impressions, standard test windows won’t reach statistical confidence in a reasonable timeframe. Widen your visual contrast between treatments (a dramatically different icon, not a subtle tweak) and extend your test window rather than abandoning testing altogether.
How Apptenium Fits Into This Workflow
Every step in this playbook, audit, keyword research, creative testing, KPI tracking, is easier when the data lives in one place instead of scattered across App Store Connect, Play Console, Firebase, and a spreadsheet nobody updates.
Apptenium runs ASO scanning against your live listing, flags metadata and creative issues with AI-generated recommendations, tracks keyword rank movement over time, and pulls competitor intelligence without requiring you to open five separate tools. It also integrates directly with Firebase and Google Analytics, so your conversion and revenue data sit next to your ranking data instead of in a separate dashboard.
Running your Week 1 audit shouldn’t take a full day of manual cross-checking. A scan should tell you, in minutes, which fields are underperforming and which creative assets need a test.
To put this into practice: run a free scan to establish your baseline, export the flagged keyword gaps into your research basket, schedule your first creative test using the priorities the scan surfaces, and check back weekly to track how your KPIs respond.
How Do You Write a Description That Actually Converts?
Your description has two jobs on iOS and one extra job on Google Play, where it’s also a ranking input. Either way, the writing rules are the same.
Lead with a single sentence that states what your app does and for whom, before any feature list. Someone skimming a product page decides in the first line whether to keep reading, and a vague opener (“Welcome to the future of productivity”) tells them nothing.
Break the body into short scannable chunks: a one-line hook, then three to five benefit statements (not feature statements), then social proof or credentials if you have them, then a closing line with a light call to action. “Track expenses in seconds” persuades more than “Our app features an expense tracking module,” because it states the outcome, not the mechanism.
Avoid dense paragraphs entirely. Use line breaks generously and consider light formatting like a short bulleted feature list near the bottom, after you’ve made the emotional case in prose. On Google Play specifically, weave your secondary keywords naturally into the first 1 to 2 sentences of your full description, since that field carries real indexing weight, but never at the expense of a sentence that reads like it was written for an algorithm instead of a person.
Read your description out loud before publishing it. If you stumble over a sentence or it sounds like a press release, a real user will skim past it too.
What This Guide Gets Right (and What It Doesn’t Tell You)
The biggest mistake teams make isn’t skipping steps in this playbook, it’s chasing keyword rank for terms that sound impressive in a report but don’t convert. A top-10 ranking for a vanity keyword with wrong-fit users just inflates your uninstall rate later.
Coordinate with product and engineering before you credit or blame ASO for a metric swing. A crash spike from an unrelated release will mask a genuinely good creative win every time.
— Mike
Try Apptenium’s Free ASO Scanner Before Your Next Update
Apptenium gets you from “I think our listing has problems” to a prioritized fix list in minutes, not days of manually cross-checking App Store Connect, Play Console, and a spreadsheet.
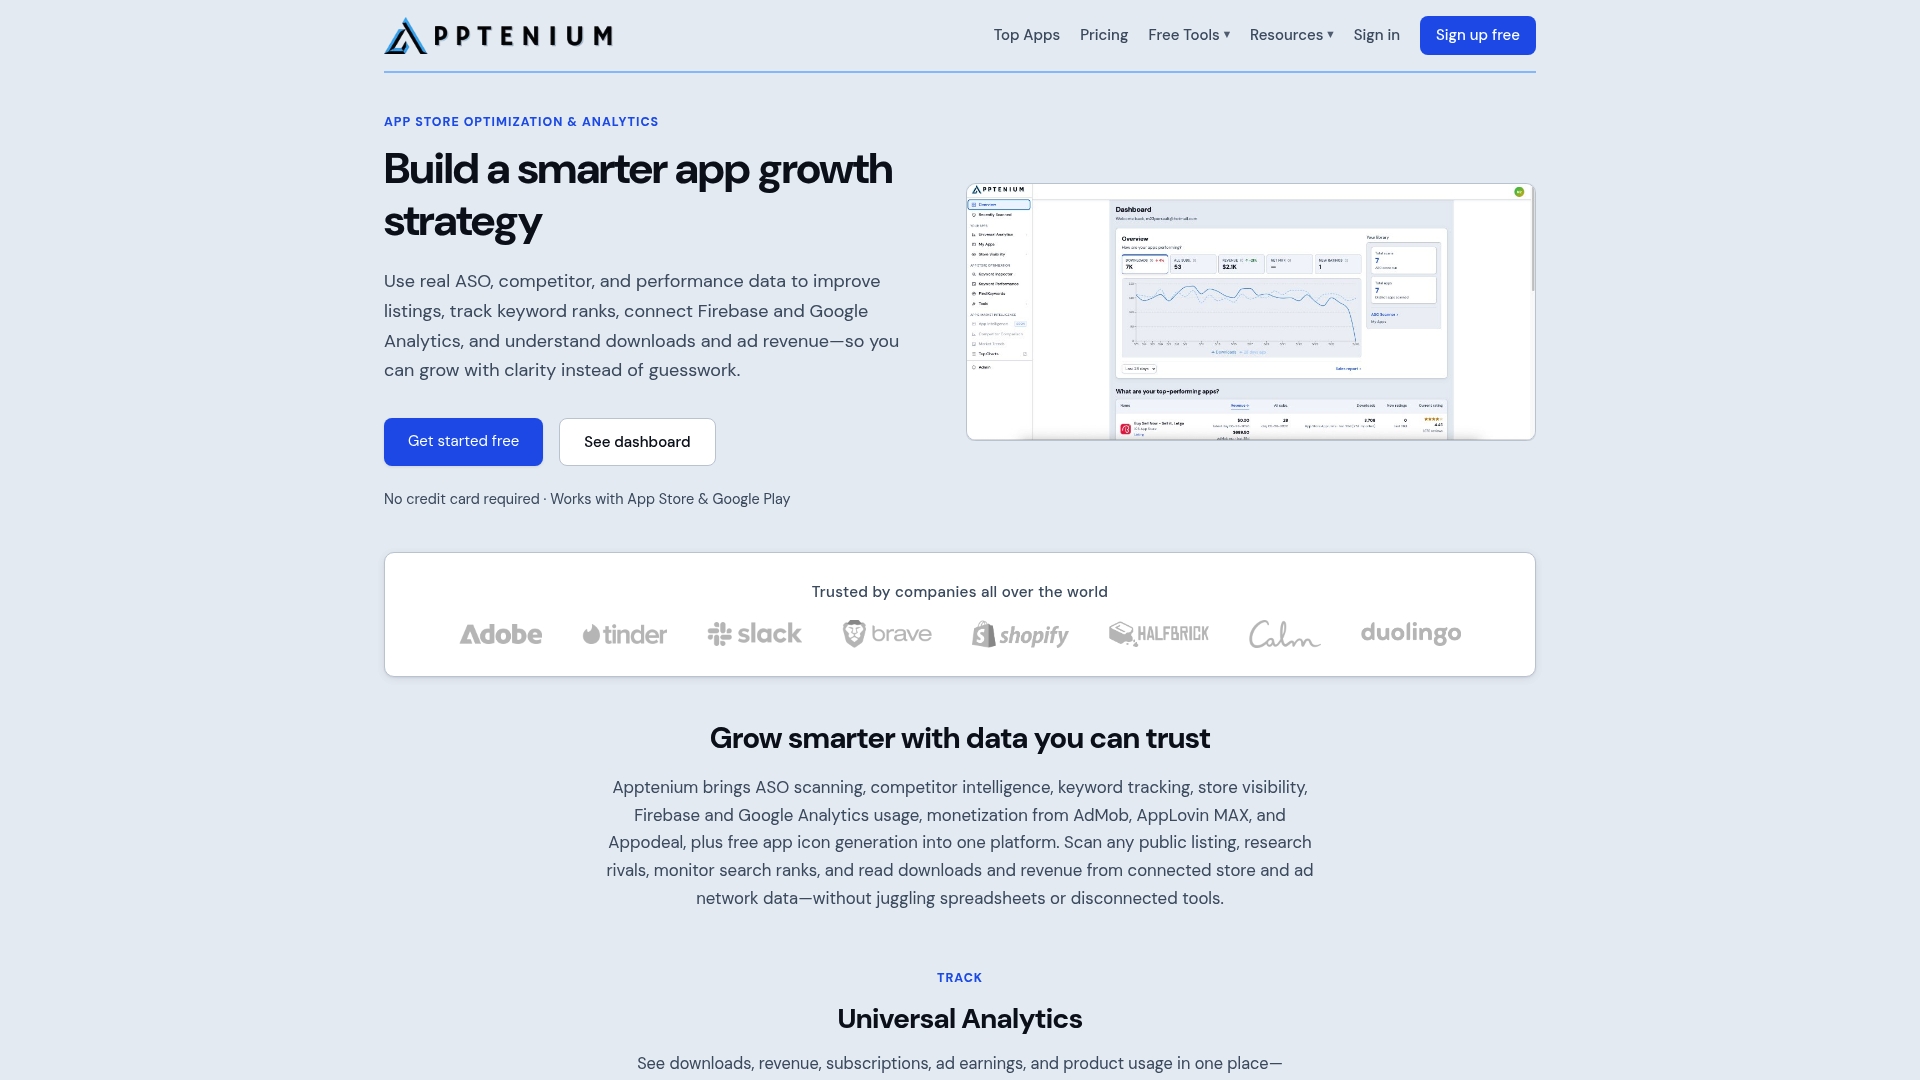
The free ASO Scanner runs a basic audit of your metadata, flags keyword coverage gaps against your basket, and highlights the top creative issues holding back conversion, all without a credit card. Run it before you touch your title or icon, and you’ll know exactly which field or asset to prioritize first instead of guessing. If your audit turns up more than a handful of issues, or you’re managing several apps and want continuous tracking instead of a one-time snapshot, Apptenium’s SMB plan adds ongoing keyword tracking, AI-generated fix recommendations, and direct Firebase and Google Analytics integration so your ranking data and revenue data finally sit in one dashboard. Start with the free scan this week and decide from there whether continuous tracking earns its place in your workflow.
Sources
- Product Page Optimization - App Store
- App Store search - App Store - Apple Developer
- The Complete Guide to App Store Optimization (ASO) | MWM Guides
- App Store Optimization 2026: The Complete Indie Guide — LaunchShots
FAQ
How much does app store listing optimization cost?
Costs range widely: manual optimization using free platform tools costs nothing but your time, while dedicated ASO software subscriptions typically run from free tiers with limited scans up to monthly plans for continuous tracking and AI recommendations, like Apptenium’s SMB plan.
What does “app store optimization” mean?
App store optimization is the ongoing process of improving your app’s metadata, creative assets, and post-install quality signals so it ranks higher in search and converts more of the people who see it into installs.
How is ASO different from SEO?
ASO optimizes for app store search algorithms and factors like conversion rate, ratings, and screenshot OCR text, while traditional SEO optimizes for web search engines using backlinks and page content; the underlying logic of relevance and user behavior overlaps, but the specific signals and fields differ entirely.
Does Apple still take 30%?
Apple’s standard commission is 30% on most digital transactions, though it drops to 15% for small businesses under a certain revenue threshold and for subscriptions after a customer’s first year; rates vary by program, so check Apple’s current developer terms for your specific situation.
How long does it take to see ASO results?
Metadata changes typically influence ranking within 7 to 14 days as the algorithm re-indexes your listing, while creative changes tested through Apple’s Product Page Optimization or Google Play experiments can take up to 90 days to reach full statistical confidence, depending on your traffic volume.