Break Even CPI for App Marketers: 2026 Benchmarks and Checklist

Break Even CPI for App Marketers: 2026 Benchmarks and Checklist
In 2026, iOS CPI generally runs 1.5 to 3 times higher than Android across most categories, so treat those platform bands as your starting reference point, not your target. The number that actually matters more than any industry chart is the one you calculate yourself: your break-even CPI, based on your app’s revenue per user and conversion rate. Country and vertical swing costs more than the calendar does, so once you’ve absorbed the headline ranges below, jump to the break-even formula and run your own math.
TL;DR:
- Your break-even CPI depends on your app’s revenue per user, expected paid months, and conversion rate, not industry averages or platform benchmarks.
- iOS CPI remains higher than Android due to increased ad spend and limited targeting signals caused by Apple’s privacy restrictions, especially in high-value markets.
- Creative quality accounts for 60 to 80 percent of CPA variance, making frequent testing and refreshing essential to controlling CPI.
- Accurate CPI measurement requires proper configuration, verification windows matching monetization models, and cohort analysis to avoid fraud and low-value installs.
- Using tools like Apptenium helps connect CPI data with post-install KPIs, enabling precise budget adjustments based on your specific app metrics.
Table of Contents
- CPI Benchmarks 2026 by Platform, Region, and Vertical
- How to Calculate Your Break-Even CPI
- Which Channels Drive CPI, and Why Creative Matters More Than the Platform You Pick
- How to Measure CPI Without Getting Fooled by Bad Data
- How Apptenium Helps You Turn Benchmarks Into Action
- Where 2026 CPI Pressure Is Actually Coming From
- Get Your Own Break-Even CPI Numbers With Apptenium
- Where to Track CPI Data Going Forward
- Sources
- FAQ
CPI Benchmarks 2026 by Platform, Region, and Vertical
Cost per install isn’t one number. It’s a distribution shaped by three forces: platform, geography, and app category, and any of the three can move your CPI by a multiple, not a fraction.
Platform is the first split. iOS installs generally cost more than Android installs, and that gap has widened. Global UA spend hit $78 billion in 2025, with iOS driving most of that growth at a strong year-over-year increase. More advertisers competing for a fixed inventory of iOS impressions pushes auction prices up, and Apple’s privacy-driven targeting limits mean advertisers pay a premium for the more precise signals that remain. Business of Apps has tracked this iOS premium across multiple years, and channel-level ranges like iOS running $1.50 to $3.50 globally still hold as a reasonable planning band.
Regional tier matters just as much. Tier 1 markets like the United States, United Kingdom, Canada, and Australia carry the highest CPIs because they combine dense competition with high purchasing power. Tier 3 markets in parts of Southeast Asia, Latin America, and Africa often deliver installs at a fraction of that cost, though the users behind them frequently monetize at a fraction of the rate too. A cheap install in a low-tier market is worthless if your app’s revenue model depends on a Tier 1 spender.
Vertical is where the real spread shows up. According to IdeaEquity’s 2026 benchmark data:
- Hypercasual games sit at the low end, often just cents per install, because volume and virality drive their economics.
- Mid-core games land in a moderate middle band, reflecting longer session times and stronger retention expectations.
- Fintech apps command some of the highest CPIs in the market, since a single funded user can be worth hundreds of dollars in lifetime value.
- Shopping and e-commerce apps sit in a wide range depending on seasonality and average order value.
Treat every range as a distribution, not a guarantee. Your actual CPI depends on your creative quality, your targeting precision, and how competitive your specific audience segment is that week.
How to Calculate Your Break-Even CPI
Industry benchmarks tell you what other apps pay. They don’t tell you what you can afford to pay. That number comes from a formula, not a report.
Break-even CPI = net revenue per paying user × expected paid months × install-to-paid conversion rate.
Here’s how to build each input:
- Net revenue per paying user. Take your subscription or purchase price and subtract the store’s cut (typically 15 to 30 percent depending on revenue tier and program eligibility). This is your realized revenue per transaction, not your sticker price.
- Expected paid months. Use retention data as a proxy. If your average paying subscriber sticks around for four months before churning, that’s your multiplier. Early-stage apps without enough history should use a conservative estimate and revisit it monthly.
- Install-to-paid conversion rate. This is the percentage of total installs that convert into a paying user. For most consumer subscription apps, this sits in the low single digits, though it varies widely by category and onboarding quality.
Quick math: A subscription app charging $9.99/month, with a 70% net revenue share after store fees ($6.99), an average paid lifespan of 4 months, and a 3% install-to-paid conversion rate has a break-even CPI of $6.99 × 4 × 0.03 = $0.84.
That $0.84 is the ceiling. Bid above it and you’re buying installs that lose money once you account for your real conversion funnel.
Pro Tip: Don’t lock in these inputs from launch-day data. Measure conversion to day 7 for an early read and day 30 for a fuller picture of monetization, since paid conversion and retention curves often shift meaningfully after the first week. AppsFlyer’s comparison of CPI and CAC makes the same case: CPI alone tells you acquisition cost, but pairing it with ARPU and LTV is what tells you whether that cost was worth paying.
Which Channels Drive CPI, and Why Creative Matters More Than the Platform You Pick

Channel choice affects your CPI, but not as much as most teams assume. Meta typically runs above Google App Campaigns on a pure CPI basis, reflecting its more competitive auction dynamics and broader advertiser base. TikTok’s CPI varies widely by vertical and creative format, sometimes undercutting both, sometimes not. Apple Search Ads commands a real premium, but it delivers high-intent installs from users already searching for your category, which often justifies the higher entry cost.
Here’s the part that surprises most teams: creative explains 60 to 80 percent of CPA variance, not channel selection. Two advertisers running identical budgets on the same platform can see wildly different CPIs, and the difference almost always traces back to creative freshness and volume.
- High-performing UA teams test 15 to 40 new creative concepts per month, not per quarter.
- Repurposing top-performing creative into native formats (vertical video, in-feed style) tends to outperform static banner reuse.
- Creator-driven pay-per-install deals can beat platform auctions for niche verticals where influencer trust converts better than algorithmic targeting, though they scale less predictably than programmatic buys.
Pro Tip: Build a creative refresh calendar the same way you’d build a content calendar. Teams that treat creative as a one-time asset instead of a recurring pipeline are the ones whose CPI creeps upward every month, even with a flat budget.
How to Measure CPI Without Getting Fooled by Bad Data
A cheap CPI means nothing if the installs behind it are fraudulent or worthless. Measurement discipline is what separates a real benchmark from a vanity metric.
- Configure your mobile measurement partner (MMP) or SDK correctly before you compare any number to an industry benchmark. Misattributed installs will make your CPI look better or worse than reality.
- Choose a verification window that matches your monetization model. Day 7 is the standard checkpoint for early signal; day 30 gives you a fuller read on apps with longer purchase or subscription cycles.
- Watch for fraud indicators, including sudden install spikes with no matching spend increase, unusually clustered IP ranges, or click-to-install times that are physically implausible.
- Use cohort metrics, not just install counts. Activation rate, trial starts, and paid conversion by cohort will tell you whether a low CPI source is actually cheap or just low-value.
- Align your CPI targets with post-install KPIs like ARPU and D7/D30 retention. A campaign hitting its CPI goal while missing its activation rate isn’t a win.
How Apptenium Helps You Turn Benchmarks Into Action
Benchmarks are only useful once you connect them to your own numbers, and that’s the gap most UA teams get stuck in. Apptenium integrates Firebase, Google Analytics, and ad network data into one view, so your CPI figures sit next to the post-install signals that actually determine whether an install was worth buying.
- See downloads, revenue, and ad monetization data in the same dashboard instead of stitching together exports from three platforms.
- Get AI-powered recommendations that flag listing and creative changes likely to lift organic discovery, reducing how hard your paid budget has to work.
- Follow a simple workflow: import your ad data, calculate your break-even CPI using the formula above, then prioritize whichever fixes Apptenium’s ASO scanning surfaces first.
The goal isn’t just tracking CPI. It’s shortening the distance between seeing a number and knowing what to do about it.
Where 2026 CPI Pressure Is Actually Coming From
AI tools now let small teams generate creative variants at a pace that used to require an agency, but that just moves the real bottleneck to attention: more creative volume means users see more ads, not that any single ad works better. iOS budget concentration, with spend growing far faster than Android’s, will keep pushing iOS CPI upward, so split your targets by platform rather than blending them into one blended number. The efficiency winners in 2026 will be the teams testing creative fastest, measuring to day 7 instead of waiting a month, and tying every CPI decision back to post-install value.
— Mike
Get Your Own Break-Even CPI Numbers With Apptenium
Industry ranges are a starting point, but Apptenium is built for the step that actually changes your budget decisions: turning those ranges into a break-even CPI specific to your app. Apptenium centralizes your Firebase, Google Analytics, and ad network data in one dashboard, so you’re not manually reconciling three exports every time a campaign needs a gut check.
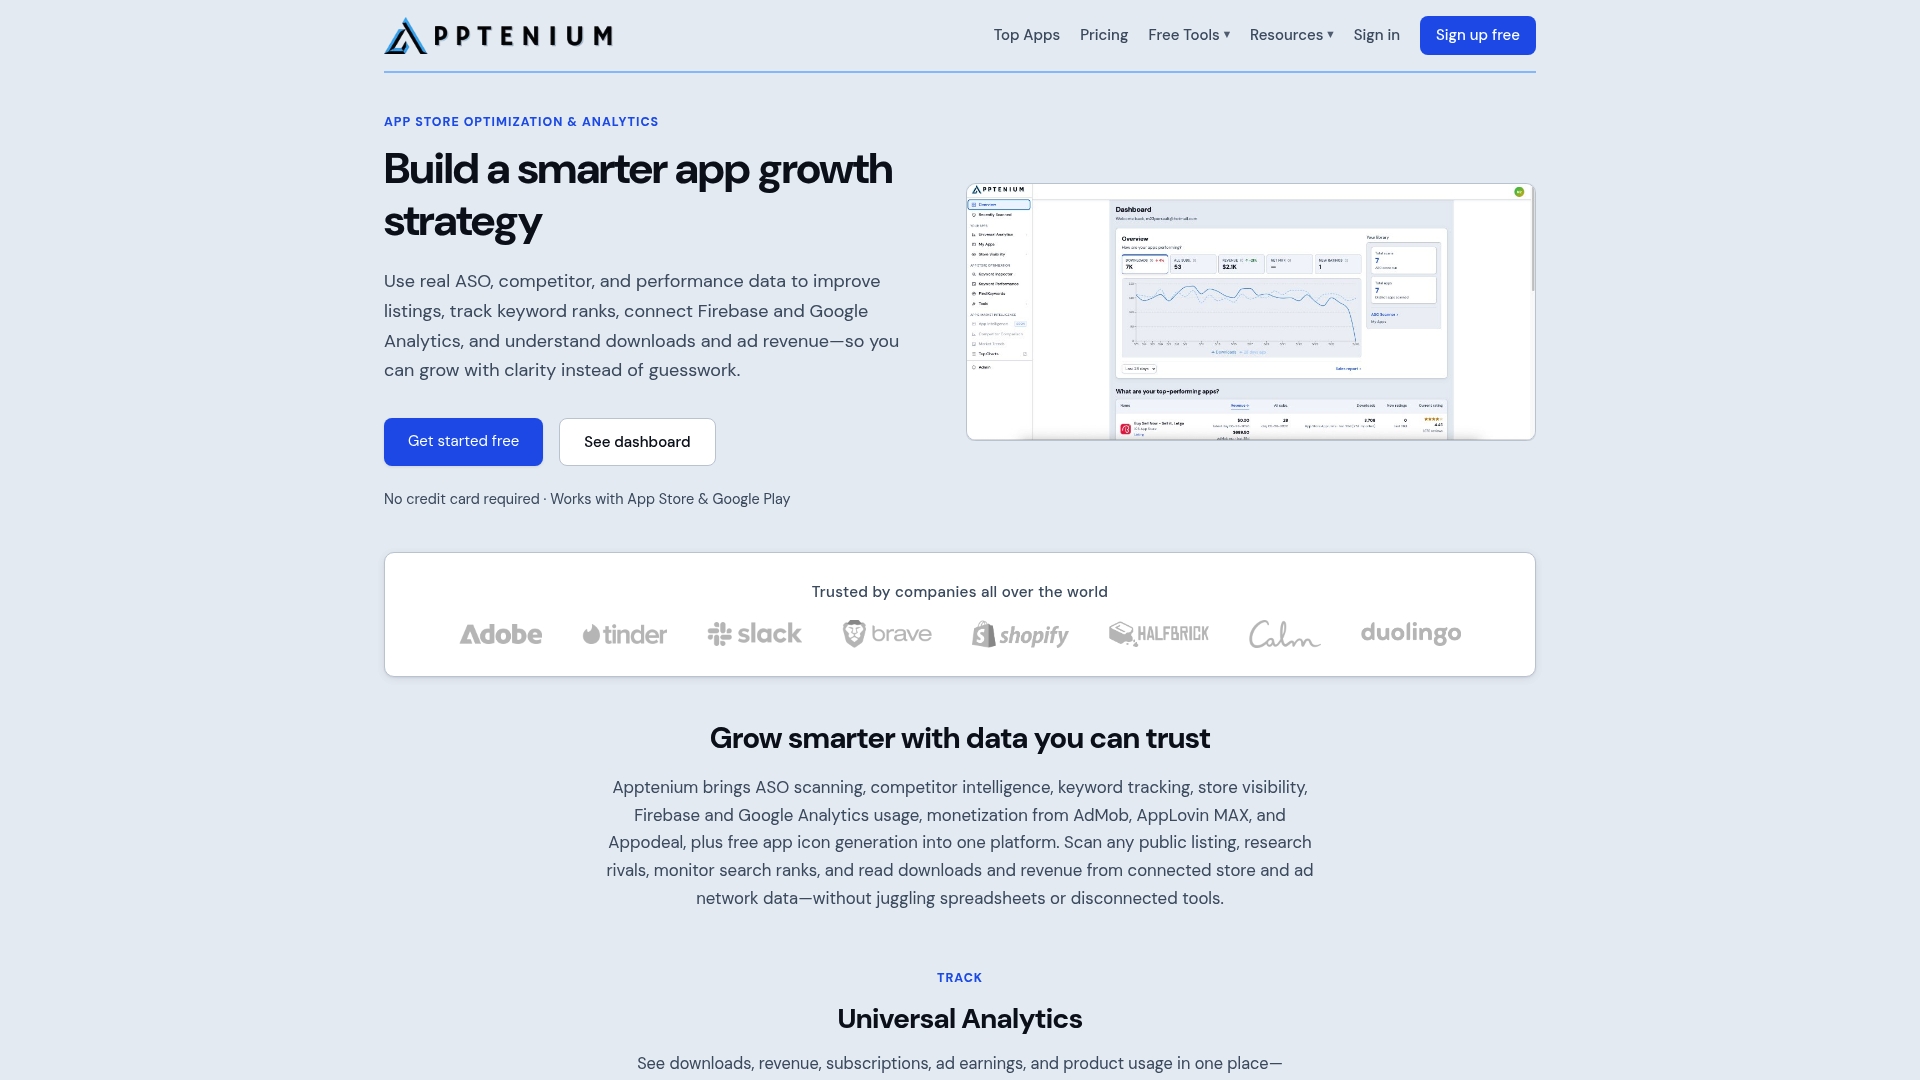
The Free plan lets you run a scan and see where your listing and performance data stand today, with no commitment required. If you’re managing paid campaigns at scale and want unlimited scans plus AI-powered recommendations, the Pro plan runs $9.99 per month. Either way, the next step is the same: pull your own numbers into Apptenium, calculate your break-even CPI using the formula above, and let the platform’s recommendations tell you whether your money is better spent on a listing fix or a bigger ad budget.
Where to Track CPI Data Going Forward

Refresh your benchmarks quarterly using Business of Apps for historical trend context and IdeaEquity’s 2026 vertical breakdown for category-specific ranges.
Sources
- Cost Per Install (CPI) research — Business of Apps
- Top data trends of 2025 shaping 2026 strategy | AppsFlyer
- Cost Per Install Benchmarks 2026: iOS vs Android by Vertical, Region, and Channel | IdeaEquity Blog | IdeaEquity
FAQ
What Is a Good CPI in 2026?
There’s no single good CPI. It depends entirely on your break-even calculation, since a $0.50 CPI can be a loss for a low-conversion app and a $5 CPI can be profitable for a high-LTV fintech app. Use the formula (net revenue per paying user × expected paid months × conversion rate) rather than comparing yourself to a generic industry average.
Why Is iOS CPI Higher Than Android?
iOS CPI runs higher largely because iOS ad spend grew a strong year-over-year increase in 2025, intensifying auction competition for a limited inventory of high-value impressions. Privacy-driven targeting restrictions on iOS also mean advertisers pay a premium for the more limited signal they do have access to.
How Often Should I Refresh My CPI Benchmarks?
Refresh quarterly at minimum, since vertical and platform ranges shift with seasonality, competition, and platform policy changes. Sources like Business of Apps and IdeaEquity update their data regularly enough to catch meaningful movement.
Does Apptenium Track CPI Directly?
Apptenium centralizes ad network, Firebase, and Google Analytics data so you can view CPI alongside downloads, revenue, and retention in one place rather than tracking it in isolation. Its AI recommendations also help identify listing and creative changes that can reduce your reliance on paid installs over time.
What’s the Difference Between CPI and CAC?
CPI measures the cost of a single install, while customer acquisition cost (CAC) accounts for the full cost of turning that install into a paying customer. AppsFlyer’s comparison recommends using CPI for top-of-funnel volume tracking and CAC alongside LTV for the profitability decisions that actually matter.