App Performance Metrics: Your ASO Playbook for 2026
The app-store metrics that predict growth before downloads move are impressions, keyword rankings, store listing conversion rate (CVR), installs by source, D1/D7/D30 retention, review velocity, and revenue per organic user (ARPU/LTV). Together, they form a visibility-to-conversion-to-growth loop: impressions tell you whether your app is being found, CVR tells you whether your listing is convincing, and retention plus ARPU tell you whether the users you’re winning are worth keeping. Your single next action: open App Store Connect or Google Play Console today and enable daily rank and impression alerts for your top 20 keywords.
The eight metrics that predict most ASO problems before downloads decline are:
Impressions / visibility score — top-of-funnel signal for search and browse traffic
Keyword rankings — movement on your tracked basket drives everything downstream
Store listing CVR — the ratio of impressions (App Store) or visitors (Google Play) to installs
Installs by source — separates organic from paid so you know what ASO is actually doing
D1 / D7 / D30 retention — the quality gate; both stores now weight engagement as a ranking signal
Review velocity — fresh, positive reviews lift conversion and store trust
ARPU / LTV — closes the loop between organic traffic and revenue
Share of voice (SOV) — your keyword coverage relative to the competitive set
Key Takeaways
Tracking the right app-store metrics in the right cadence — daily alerts, weekly CVR and rank checks, monthly retention and ARPU reviews — is the single most reliable way to catch ASO regressions before they cost you installs.
PointDetailsEight core metrics to trackImpressions, keyword rankings, CVR, installs by source, D1/D7/D30 retention, review velocity, and ARPU/LTV predict most ASO problems early.CVR improvements compoundLifting CVR from 30% to 35% at 100,000 monthly impressions adds roughly 5,000 installs per month at zero extra spend.Retention benchmarksD1 above 35% and D7 above 15% are the accepted health thresholds; falling below either risks store ranking suppression.Reporting cadenceRun daily rank alerts, weekly keyword and CVR checks, and monthly SOV and ARPU reviews to stay ahead of regressions.Apptenium integrationApptenium connects App Store Connect, Google Play Console, Firebase, and GA4 in one dashboard with AI-powered listing recommendations.
Table of Contents
What benchmarks should you target, and when will changes move metrics?
What should you test first, and how do you prioritize experiments?
What do app performance metrics actually measure in ASO?
App-store performance metrics are the quantitative signals that tell you where your app sits in the store funnel at any given moment. They are not infrastructure metrics like CPU usage or server response time. They are store-side and product-side measurements: how many people saw your listing, how many tapped through, how many installed, and how many came back.
The funnel has five layers, each with its own metric group.
Visibility metrics include impressions, SOV, and visibility score. Impressions count how many times your app appeared in search results or browse surfaces. SOV measures the share of impressions your app captures across a defined keyword set compared to competitors. These are your early-warning signals: a drop in impressions before installs fall means a ranking regression is already in progress.

Ranking metrics require a fixed keyword basket. Track 15–30 keywords — typically 5–8 high-volume “money” terms, a set of long-tail variants, and a few brand or feature terms. Weight rank movement by estimated search volume so a drop on a high-volume term triggers action faster than a drop on a niche phrase.
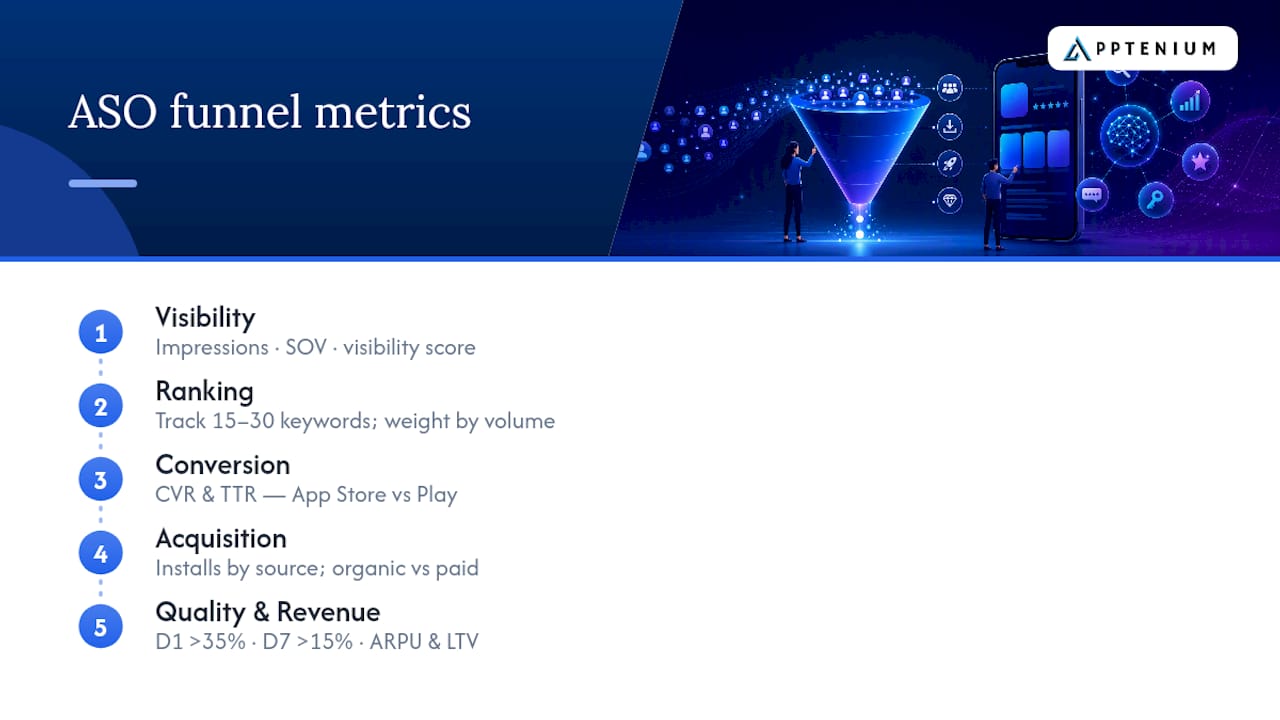
Conversion metrics split by platform. On the App Store, CVR = installs ÷ impressions. On Google Play, CVR = installs ÷ store listing visitors. Never compare the two directly — their denominators are different universes. Tap-through rate (TTR) on the App Store measures the share of impressions that became product page views, which is a useful intermediate signal for icon and screenshot performance.
Acquisition metrics break installs by source: App Store Search, Browse, Referral, Web Referral, and paid channels. Organic vs. paid split is the clearest signal of whether your ASO is working independently of spend.
Quality and revenue metrics close the loop. D1 retention above roughly 35% and D7 above roughly 15% are accepted health benchmarks that help teams avoid ranking suppression. ARPU (average revenue per user) and LTV (lifetime value) tell you whether organic users monetize as well as paid ones — a gap here often signals a targeting or onboarding problem, not a product problem.
Pro Tip: Review velocity matters as much as average rating. A steady stream of recent 4- and 5-star reviews signals active engagement to both stores and to users scanning your listing.
Conversion improvements compound against all existing traffic. Lifting CVR from 30% to 35% at 100,000 monthly impressions adds roughly 5,000 installs per month without spending a dollar on new traffic.
How do you measure these metrics reliably?
Each metric lives in a specific data source. Knowing where to pull each one prevents the most common measurement errors.
App Store Connect — impressions, product page views, App Units (new downloads), and re-downloads. Use the “Metrics” tab filtered by source type and territory. Set the date range to at least 30 days for trend visibility.
Google Play Console — store listing visitors, installs by acquisition channel (organic search, paid, referral), and Android Vitals for crash and ANR rates. The “Acquisition reports” section breaks down the full funnel.
Firebase / GA4 — retention cohorts, in-app event attribution, and revenue data. Link Firebase to GA4 and instrument acquisition events with UTM parameters so you can trace an organic keyword install through to first purchase.
Ad networks — pull postback data from your network’s dashboard or MMP (mobile measurement partner) and reconcile with console install counts weekly to catch discrepancies.
Integration checklist:
Connect App Store Connect and Google Play Console to your analytics stack
Link Firebase project to GA4 and enable Google Signals
Define a consistent event-naming convention before launch (e.g.,
first_open,tutorial_complete,purchase)Set up UTM parameters for all paid and owned traffic sources
Reconcile install counts between console and Firebase weekly for the first month
Common pitfalls to avoid:
Mismatched denominators when comparing Apple and Google CVR (see above)
Reporting window lag: App Store Connect can delay up to 48 hours; don’t pull same-day data for decisions
Redownload inflation: App Store Connect separates App Units from re-downloads; use App Units for true new-install CVR
Attribution overlap: if you run both Apple Search Ads and organic, deduplicate by source before calculating organic CVR
What benchmarks should you target, and when will changes move metrics?
Category-aware benchmarks matter because a 25% CVR is strong for a game but weak for a utility app. Use these as directional ranges, not hard targets.
MetricHealthy Range (U.S. market)NotesD1 retentionAbove 35%Below this risks ranking suppressionD7 retentionAbove 15%Key quality signal for both storesApp Store CVR (impressions→installs)3%–8% varies by categoryGames trend lower; utilities trend higherGoogle Play CVR (visitors→installs)25% varies by categoryHigher denominator threshold than App StoreReview rating4 stars and aboveRatings below average measurably suppress conversion
Timeline expectations are just as important as the benchmarks themselves. Metadata changes (title, subtitle, keywords) on the App Store typically take 1–2 weeks to index and 3–4 weeks to show measurable rank movement. Creative changes (icon, screenshots) can shift CVR within 7–14 days if you run a product page optimization test. Onboarding changes that improve D1 retention often show results within one cohort window (7–14 days). A recommended cadence: daily automated alerts for rank regressions, weekly checks of your keyword basket and CVR, and monthly reviews of SOV, retention cohorts, and ARPU/LTV.
How should you structure your ASO reporting and dashboards?
A well-structured ASO report covers five sections: downloads by source, loyal-user retention, keyword rankings by cluster, review sentiment and ratings trends, and a clear insights-and-actions list. That structure turns raw store data into priorities rather than just a status update.
Executive dashboard (one page): total installs, organic vs. paid split, average rating, D7 retention, and monthly revenue. These five numbers tell a leadership team whether the app is growing healthily.
ASO operating dashboard (full team): the complete funnel from impressions → product page views → installs, segmented by acquisition channel and country. Add a cohort table showing D1/D7/D30 retention by source so you can see whether paid users retain as well as organic ones.
Recommended review cadence:
Daily: automated alerts for rank drops of 5+ positions on money keywords, and for rating drops below your threshold
Weekly: keyword basket review, impressions trend, CVR by platform, install volume by source
Monthly: SOV analysis, retention cohort comparison, ARPU/LTV by acquisition source, metadata performance review
Seven core KPIs — keyword rankings, search impressions, CVR, install volume, ratings and reviews, retention rate, and revenue per install — should be tracked weekly and correlated across the funnel. A drop in impressions that isn’t matched by a CVR drop points to a visibility problem. A CVR drop without an impressions drop points to a creative or listing problem.
What should you test first, and how do you prioritize experiments?
Map each metric to its lever before you build a test queue.
Impressions dropping: test keyword swaps in your title and subtitle, expand your long-tail basket, and defend SOV on brand terms
CVR below benchmark: test your icon first (highest visual impact), then your first two screenshots, then your preview video, then short description copy — in that order
D1 retention below 35%: audit your onboarding flow before scaling any paid UA; a leaky onboarding erases every dollar spent on acquisition
Revenue per organic user below paid: check whether organic users land in a different onboarding path, and test price points or trial-funnel length
Prioritization matrix: score each test on impact (how much could this move the primary metric?) and complexity (how long to build and validate?). High-impact, low-complexity tests go first: icon swaps, screenshot reorders, and keyword title edits typically qualify.
A/B test plan template:
Hypothesis: “Changing [element] will increase [metric] by [X%] because [reason]”
Primary metric: one metric only (CVR, D1 retention, or ARPU)
Sample size: run until statistical significance or 2 weeks minimum
QA checks: confirm variant is live in both stores before reading data
Rollout rule: ship winner only after 95% confidence
Rollback criteria: if primary metric drops more than 5%, revert within 24 hours
Pro Tip: Most teams under-invest in onboarding and retention before scaling paid UA. Fix D1 retention first. Every percentage point of D1 improvement multiplies the return on every future acquisition dollar.
How does Apptenium fit into this measurement workflow?
Apptenium connects directly to App Store Connect, Google Play Console, Firebase, and GA4, pulling all five funnel layers into a single dashboard so you’re not toggling between four separate tools to diagnose a problem.
Here’s what a practical workflow looks like:
Connect your data sources: link App Store Connect and Google Play Console in Apptenium’s settings, then connect your Firebase/GA4 project. Apptenium surfaces your keyword basket, SOV by competitor, and CVR differences between platforms in one view.
Enable daily alerts: set rank-regression alerts for your top 20 keywords. When a money keyword drops 5+ positions, Apptenium flags it the same morning.
Follow the alert to root cause: a rank drop triggers a check of impressions (is visibility falling?), CVR (is the listing converting?), and recent reviews (is sentiment shifting?). Apptenium’s ASO scanning surfaces all three in the same session.
Launch an experiment: Apptenium’s AI-powered listing recommendations suggest which creative element to test next based on your current CVR gap versus category benchmarks. You move from alert to experiment brief in one workflow.
Close the loop with revenue: because Apptenium ties organic installs to ARPU and LTV from your Firebase/GA4 data, you can see whether a CVR improvement actually delivered higher-value users, not just more installs.
What should your team prioritize first?
The sequence that consistently delivers the fastest improvement is: connect your consoles and set daily rank alerts first, then check whether D1 and D7 retention are above benchmark before touching paid UA, then run one CVR test on your icon or first screenshot, and only then scale traffic.
The most common blind spot is scaling paid acquisition before retention is healthy. Fix the onboarding flow, validate the retention lift, and then open the spend tap. The math is unforgiving in the other direction.
Apptenium makes ASO measurement faster to act on
Tracking app-store metrics across four separate consoles and analytics tools costs your team hours every week. Apptenium consolidates App Store Connect, Google Play Console, Firebase, and GA4 into one dashboard, adds daily rank and impression alerts, and layers AI-powered listing recommendations on top so you know exactly which test to run next.
The free tier gets you keyword tracking, ASO scanning, and your first listing recommendations within minutes of connecting your app. Most teams complete their first full funnel review — impressions through ARPU — within the first week. Start your free trial at Apptenium and follow the integration checklist in this guide to have your dashboard live before the end of the day.
Sources
ASO KPIs: The Metrics That Actually Matter in 2026 | AppDrift
ASO KPIs: How to Measure Your Optimization Results | Appalize
FAQ
What are the most important app-store performance metrics to track?
The eight metrics that cover the full ASO funnel are impressions, keyword rankings, store listing CVR, installs by source, D1/D7/D30 retention, review velocity, ARPU, and share of voice. Tracking them weekly catches most problems before downloads decline.
Why are Apple and Google conversion rates not comparable?
Apple calculates CVR using impressions as the denominator, while Google Play uses store listing visitors.
What retention rates should my app hit?
Both stores weight engagement as a ranking signal, so falling below these thresholds can suppress organic visibility over time.
How quickly do ASO changes move metrics?
Metadata changes typically take 3–4 weeks to show measurable rank movement. Creative changes like icon and screenshot updates can shift CVR within 7–14 days when tested through a product page optimization experiment.
How does Apptenium help teams measure and improve these metrics?
Apptenium connects App Store Connect, Google Play Console, Firebase, and GA4 into one dashboard, surfaces daily rank and impression alerts, and provides AI-powered listing recommendations that map directly to CVR gaps versus category benchmarks.