Reconcile App Revenue Analytics in 30 Days for App Teams

Reconcile App Revenue Analytics in 30 Days for App Teams
App revenue analytics gives your team accurate proceeds tracking, cohort-level LTV, and experiment-ready data for pricing and UA decisions. Pulling from App Store Connect, Google Play Console, and a platform like Apptenium, you get a working picture of monetization within days, not months. That picture is what tells you whether to scale a UA channel, adjust a paywall, or hold your price where it is.
TL;DR:
- Tracking cohort-level ARPPU alongside overall proceeds helps identify higher-value user segments and optimize acquisition strategies.
- Revenue data from App Store Connect and Google Play Console is estimates, requiring normalization and reconciliation with server receipts for accuracy.
- Enabling daily exports, normalizing currencies, and mapping receipts to user IDs streamlines building a reliable, unified revenue dataset.
- Using revenue analytics to run experiments on pricing, trial length, and microbundles allows for data-driven adjustments that maximize long-term proceeds.
- Relying solely on store dashboards is risky; integrating ASO and monetization data into one platform improves decision-making speed and confidence.
Table of Contents
- What Are the Key Revenue Metrics Every App Team Must Track?
- Where Does Revenue Data Actually Come From?
- How Do You Build a Single Source of Truth for Revenue?
- How Should You Use Revenue Analytics to Act, Not Just Report?
- 30-Day Checklist: Setting Up Revenue Tracking From Scratch
- How I Actually Use Revenue Analytics in Product and Growth
- Getting Your Revenue and ASO Data Into One View
- Sources
- FAQ
What Are the Key Revenue Metrics Every App Team Must Track?
Not every dollar figure means the same thing, and confusing them leads to bad calls. Proceeds are what you actually keep after Apple’s or Google’s commission and taxes, while sales is the gross transaction value before those cuts. Mixing the two up is the fastest way to overstate your margin to a finance team or an investor.
Beyond that split, a handful of metrics do most of the work in monetization decisions:
- Paying users: the count of unique users who converted to a paid action in a given window
- ARPU (average revenue per user): total revenue divided by all active users, useful for broad health checks
- ARPPU (average revenue per paying user): revenue divided only by paying users, which tells you how much your converters are actually worth
- MRR/ARR: monthly and annual recurring revenue, the backbone metrics for subscription apps
- Churn and refund rates: the leak in the bucket that ARPU alone won’t show you
Each metric answers a different question. ARPU tells you if your overall base is healthy; ARPPU tells you if your paying segment is worth more UA spend. If ARPPU climbs while paying-user count holds steady, that’s usually your signal to scale acquisition, because each converted user is worth more than your cost models assumed. If MRR grows but churn also climbs, you’re running a leaky subscription funnel that will cap your ARR no matter how much new UA you throw at it.
Pro Tip: Track ARPPU by cohort, not just in aggregate. A rising blended ARPPU can hide a shrinking high-value segment if your newer cohorts are lower-quality.
Where Does Revenue Data Actually Come From?
Every revenue number in your dashboard traces back to one of three upstream sources, and each has a different refresh rate, granularity, and blind spot.
App Store Connect is Apple’s own system of record. It exposes sales and proceeds metrics, along with cohort widgets that show download-to-offer rates and accumulated proceeds over time, and it supports bulk exports through the App Store Analytics API. The catch: proceeds are an estimate. Apple’s own documentation notes that proceeds may not match your final payout once exchange rates and the full transaction lifecycle settle out.
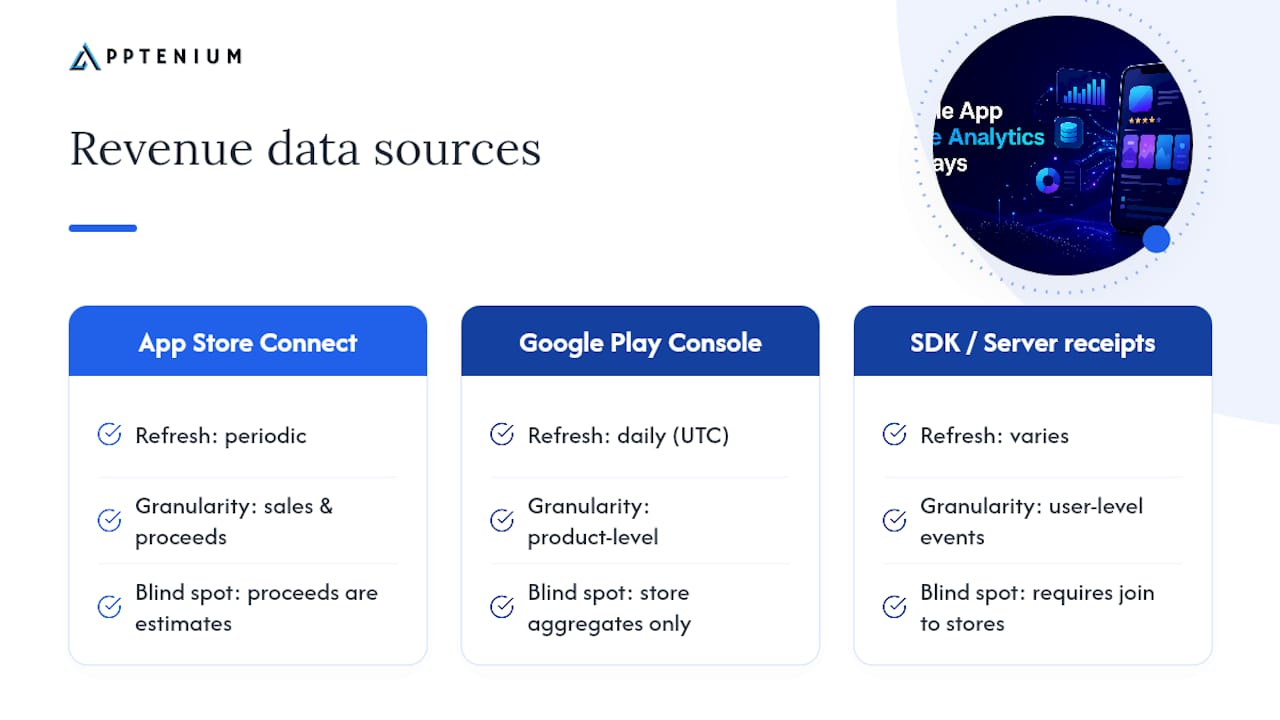
Google Play Console works similarly but on Android’s terms. It gives you revenue pages with product-level breakdowns, filterable by date and country, refreshed daily on a UTC clock, with CSV export for finance reporting.
SDKs, server receipts, and ad network feeds fill the gap both stores leave open: user-level purchase events, refund flags, and ad revenue attribution tied to a specific user ID rather than an aggregate line item. You need that granularity for any cohort join or LTV model, because store dashboards alone won’t let you trace a dollar back to the install that generated it.
How Do You Build a Single Source of Truth for Revenue?
Running three data sources side by side, each with its own refresh schedule and currency quirks, is how teams end up with three different revenue numbers in three different meetings. Centralizing that data into one reconciled dataset is the fix, and it’s not a huge lift if you sequence it right.
- Enable exports on both stores. Turn on App Store Connect’s analytics exports and Play Console’s CSV exports, and schedule daily automated pulls rather than manual downloads.
- Normalize currency and commission. Convert every figure to one reporting currency and apply a consistent tax and commission model before you aggregate anything, or your country-level comparisons will be meaningless.
- Map receipts to user IDs. Join server receipts and SDK events to the same identifier your product analytics uses, so a purchase event and a session event describe the same person.
- Build reconciliation checks. Compare your aggregated store proceeds against finance’s actual payout monthly, and set an alert threshold (say, a 3% variance) that flags drift automatically instead of waiting for someone to notice a discrepancy by hand.
Integration priority matters here. Firebase or Google Analytics event data, server-side receipts, and your mobile measurement partner’s attribution data should land first, because those three feeds cover acquisition, behavior, and payment in one pass. Ad network revenue can come next, since it usually needs its own attribution logic. Use event-level joins when you’re building LTV cohorts and aggregated joins when you’re just checking totals against store dashboards.
Pro Tip: Keep raw export snapshots even after you’ve reconciled them. When a discrepancy shows up three months later, you’ll need the original file to figure out whether it was a refund, a currency shift, or an actual reporting error.
How Should You Use Revenue Analytics to Act, Not Just Report?
A dashboard that only reports numbers back to you isn’t doing its job. Revenue analytics should function as an operational loop: form a hypothesis, run an experiment, read the cohort-level proceeds, and scale whatever wins. Teams that treat their revenue data this way, rather than as a static report, move faster because every dollar of new data feeds the next decision instead of sitting in a slide deck.
Three experiment types tend to move revenue the most:
- Trial length changes: a 7-day trial versus a 3-day trial can shift both conversion rate and 30-day retained revenue in opposite directions, so you need to measure both together
- Price point tests: even a small shift, like $4.99 to $6.99, can change ARPPU without proportionally hurting conversion, especially in markets less sensitive to price anchoring
- Microtransaction bundle tests: bundling two low-value items often outperforms selling them separately, because it raises average order value more than it suppresses volume
Measure each of these by proceeds per cohort, not by raw conversion rate. A paywall variant that converts fewer users but retains them longer can beat a high-conversion variant on 90-day proceeds, and conversion rate alone will never show you that.
Once you have a few weeks of cohort proceeds data, you can convert it into a forecast. Industry guidance from analytics vendors like Mixpanel recommends turning cohort revenue curves into LTV projections, then setting your ROAS and CPA targets off that number instead of off blended install cost. If your 90-day cohort LTV comes out to $8.40, your UA team now has a real ceiling for what a install is worth in a given channel, rather than a guess.
30-Day Checklist: Setting Up Revenue Tracking From Scratch
You don’t need a quarter to get reliable revenue analytics running. Here’s a realistic 30-day sequence:
- Days 1–7: Enable App Store Connect and Play Console exports, connect your analytics SDK (Firebase or equivalent), and validate that receipts are actually landing where you expect them.
- Days 8–21: Normalize your data across currencies and stores, build your first download-to-paid cohort, and calculate ARPPU and proceeds broken out by country.
- Days 22–30: Launch one paywall A/B test, track proceeds by cohort through the test window, and write down your reconciliation rules so the next person on your team doesn’t have to reverse-engineer them.
By day 30, you should have a working baseline, one completed experiment, and a documented process instead of a pile of spreadsheets nobody trusts.
How I Actually Use Revenue Analytics in Product and Growth
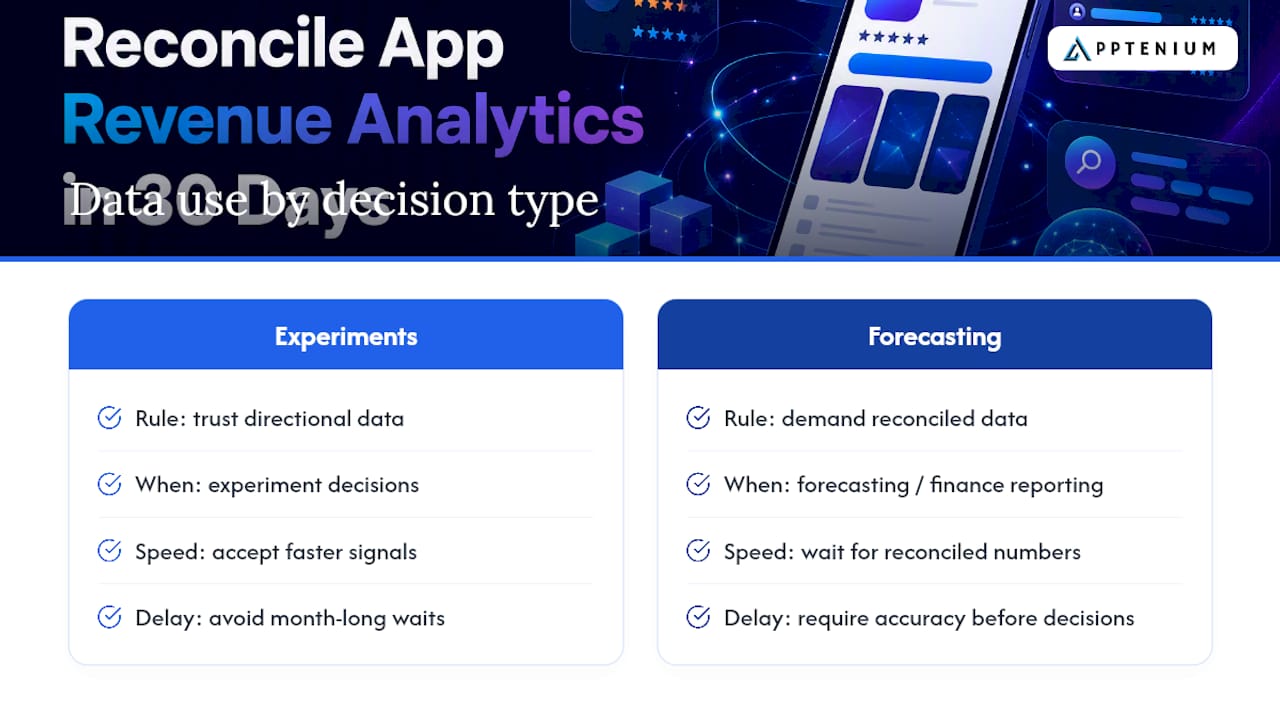
The hardest trade-off in revenue analytics isn’t technical, it’s about trust versus speed. Every team wants clean, fully reconciled numbers before making a decision, but waiting for perfect data means you ship experiments a month late. My rule of thumb: trust directional data for experiment decisions (is this paywall variant winning or losing?) and demand reconciled data for anything that touches forecasting or finance reporting.
I’ve watched a promising pricing experiment get killed because someone compared App Store proceeds (post-commission) against a Play Store sales figure (pre-commission) and concluded the test had failed. It hadn’t. The lesson stuck: reconciliation isn’t bureaucratic overhead, it’s what stops you from making the wrong call on real money.
— Mike
Getting Your Revenue and ASO Data Into One View
Apptenium closes the gap between what your store dashboards show and what actually drives revenue, by putting ASO performance and monetization data in the same view instead of forcing you to toggle between five tools. You get keyword tracking, competitor intelligence, and AI-generated listing recommendations alongside downloads, revenue, and subscription metrics pulled from integrations with Firebase and Google Analytics.
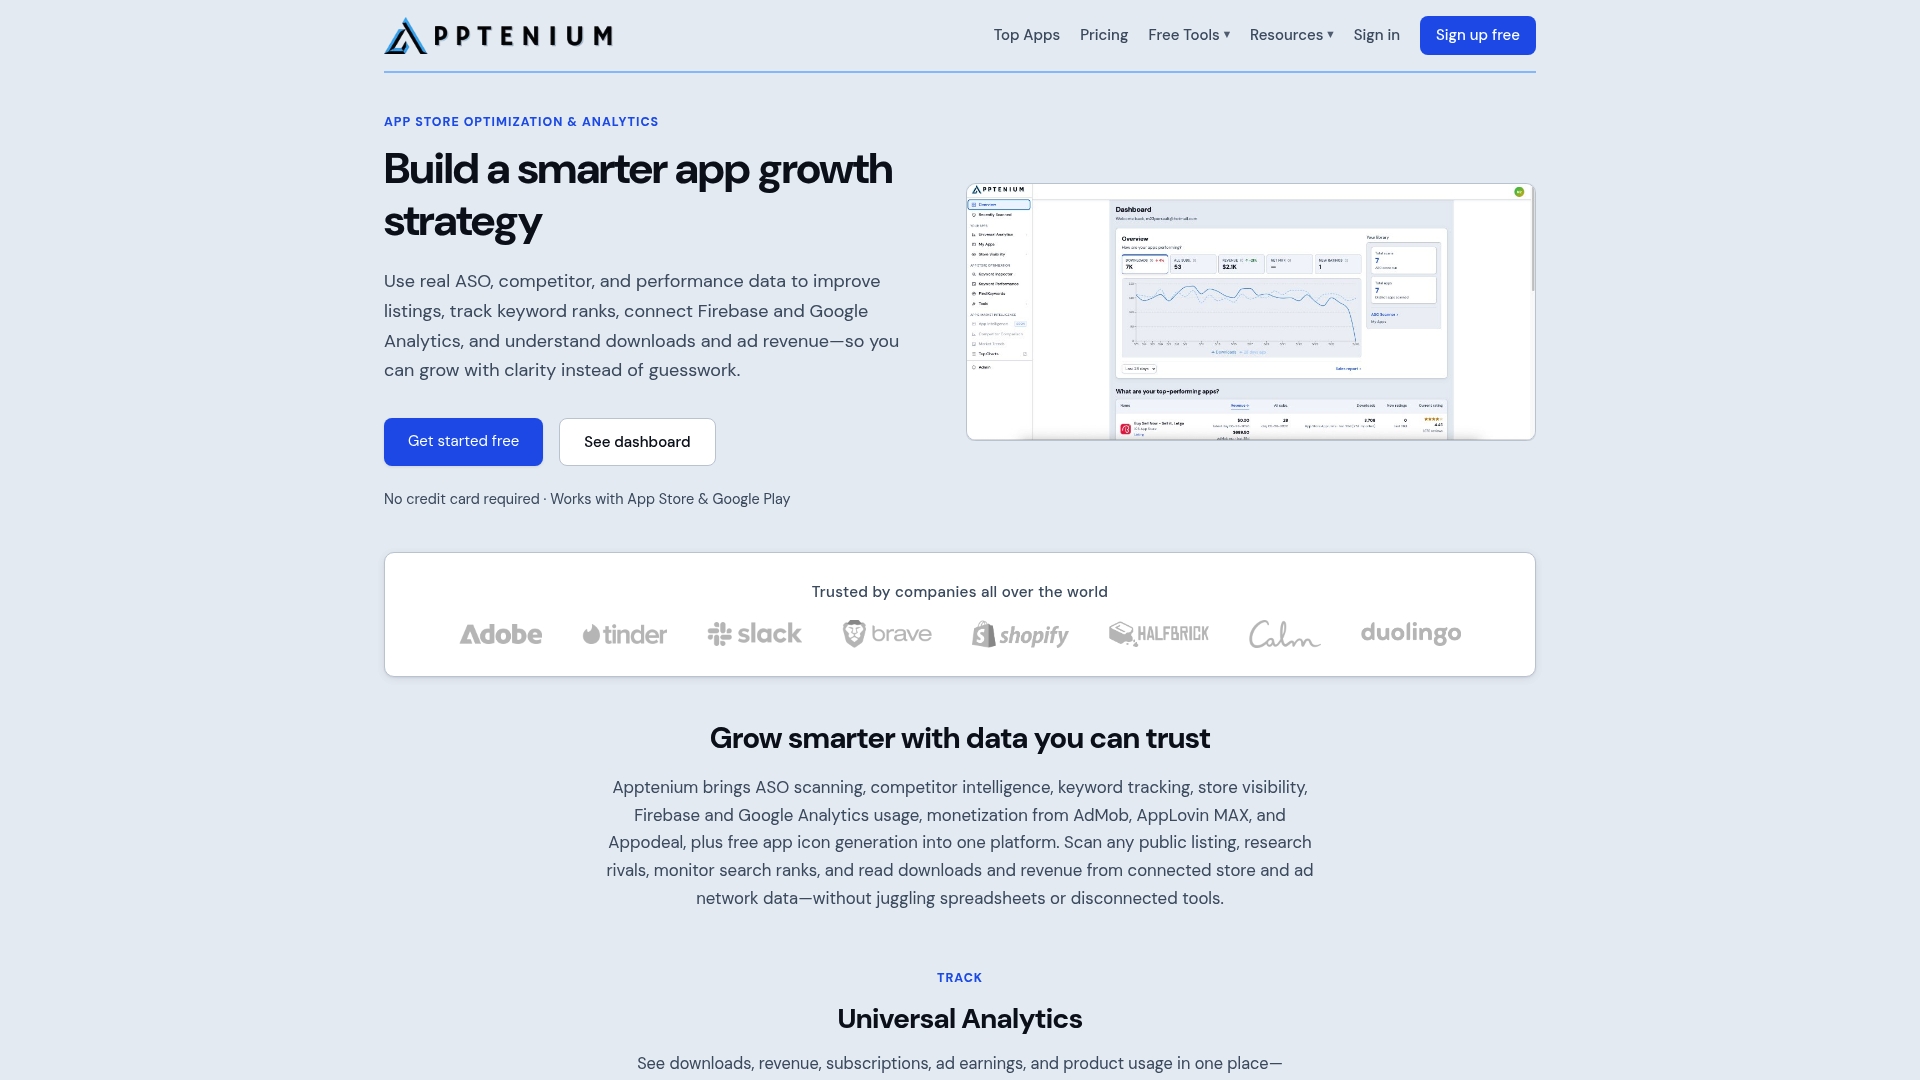
That matters because the checklist above only works if your listing changes and your revenue changes live in the same dashboard. When a keyword swap or an icon update moves your install rate, you want to see that shift against ARPPU and proceeds without exporting three CSVs first. Start with a free ASO scan to see where your current listing stands, then move into the Pro plan once you’re ready for unlimited scans and the full revenue-and-ranking view. Most teams that follow this path see their first real optimization signal, a clear read on which keyword or pricing change actually moved revenue, inside their first 30 days.
Sources
- Sales - Monetization - App Store Connect Analytics - Help - Apple Developer
- Review your app’s revenue and buyer data - Play Console Help
- Mixpanel blog: revenue analytics (industry guidance)
FAQ
What Is the Difference Between Proceeds and Sales?
Sales is the gross transaction amount before any commission or tax; proceeds is what you actually keep after Apple’s or Google’s cut and applicable taxes are deducted.
Which Metric Should I Watch for Pricing Decisions?
ARPPU is the most useful metric for pricing decisions because it isolates how much your paying segment is worth, separate from your total active user base.
How Often Does Revenue Data Refresh in the App Stores?
Google Play Console refreshes revenue data daily on a UTC clock, while App Store Connect updates sales and proceeds figures on its own schedule tied to transaction processing.
Can I Rely on Store Dashboards Alone for LTV Modeling?
No. Store dashboards give you aggregated proceeds and sales, but LTV modeling needs user-level receipt data from SDKs or server-side events to join purchases to specific cohorts.
How Does Apptenium Help With Revenue Analytics?
Apptenium connects ASO performance data with revenue, downloads, and subscription metrics through integrations with Firebase and Google Analytics, giving you one dashboard instead of several disconnected exports.