Best App Analytics Tools for Mobile Teams in 2026
For most mobile teams, the best app analytics tools come down to three categories: an ASO-first platform for listing optimization and download tracking, an event-based product analytics tool for funnels and retention, and a dedicated mobile measurement partner (MMP) for attribution. If you need all three signals in one place, Apptenium is the recommended starting point. For pure product analytics, Amplitude or Mixpanel lead. For attribution, AppsFlyer is the standard.
Here is a quick shortlist by job-to-be-done:
ASO + integrated analytics: Apptenium
Product analytics (funnels, retention, experimentation): Amplitude, Mixpanel, PostHog
Marketing attribution and campaign ROI: AppsFlyer
Session replay and UX debugging: UXCam, PostHog
Crash reporting and stability: Sentry
Privacy-first / self-hosted: Countly
App store review monitoring: AppFollow, AppTweak, Apptenium
Pick your primary job-to-be-done from that list, then use the comparison table below to filter by pricing and platform.
Key Takeaways
The most effective approach to mobile app analytics is to match your tool to your primary job-to-be-done, then layer in specialized tools only where the core stack has a genuine gap.
PointDetailsMatch tool to jobPick by primary goal: product analytics, attribution, session replay, crash reporting, or ASO.Event-based wins long-termEvent-based data models support cohort and retention analysis that session-based tools cannot replicate.Hidden costs add upWatch for data volume overages, seat limits, and BigQuery export fees on free and entry-level tiers.Privacy shapes platform choiceSelf-hosted options like Countly and PostHog reduce GDPR/CCPA compliance overhead for U.S. teams.Apptenium for ASO-first teamsApptenium integrates keyword tracking, AI listing recommendations, and Firebase analytics in one platform.
Table of Contents
Tool-by-tool breakdown: features, pricing, and when to pick each
What are the trade-offs between product analytics, attribution, and session replay?
What are the best app analytics tools right now?
The Gartner mobile app analytics market review identifies session replay, attribution, integrations, and self-hosting as the primary differentiators across vendors. That framing holds up in practice. The tools that consistently rank highest are the ones that do one job exceptionally well, not the ones that try to cover every category at once.
The table below covers all 23 tools in this comparison across the dimensions that actually matter for your buying decision.
Pricing callouts to know before you commit:
Firebase Analytics is genuinely free with no seat limits, supporting up to 500 distinct event types, but raw BigQuery export requires a Google Cloud billing account.
Amplitude’s free tier covers a substantial number of monthly tracked users; beyond that, pricing scales for enterprise contracts.
AppsFlyer operates on a pay-per-attributed-install pricing model after the free trial, which can increase costs for high-volume campaigns.
PostHog offers a generous free tier with a high event limit, making it an accessible entry point for many users.
Countly offers a free, self-hosted Community Edition; their Enterprise Edition includes additional support and compliance features.
RevenueCat offers a free tier with a revenue threshold, after which charges apply to revenue exceeding that amount.
How we selected these tools: Every tool in this list was evaluated against four criteria: feature depth for at least one core job-to-be-done (product analytics, attribution, session replay, crash reporting, or ASO), transparent or publicly documented pricing, active SDK maintenance for iOS and/or Android, and availability to U.S.-based teams. Tools with discontinued core products (Facebook Analytics for Apps) are noted as such.
Tool-by-tool breakdown: features, pricing, and when to pick each
Apptenium
Apptenium sits at the intersection of ASO and analytics, which is a gap most pure product analytics tools leave open. The platform scans your app listing metadata, tracks keyword rankings and competitor movements, and surfaces AI-powered recommendations for improving your store listing. On the analytics side, it pulls in download and revenue data, subscription metrics, and ad monetization signals, with direct integrations into Firebase and Google Analytics.
Platforms: iOS, Android. Free tier: Yes, with limited scans per month. Paid tier: Unlimited scans, full keyword tracking, and premium AI recommendations.
Best for: App marketers and developers who want to connect listing performance (impressions, conversion rate, keyword rank) with downstream analytics (activations, revenue) without stitching together three separate tools. The free app icon generator is a useful bonus for teams iterating on creative assets.
Implementation is lightweight. Connect your app store accounts, link Firebase or Google Analytics, and you get a unified view of ASO and performance metrics within a few days.
Amplitude
Amplitude is the benchmark for enterprise product analytics. Its suite covers event tracking, funnels, cohort analysis, session replay, heatmaps, and experimentation, plus AI-enabled features for automated insight generation. The free tier supports up to 50,000 MTUs, which covers most early-stage apps. Beyond that, pricing moves into custom enterprise contracts.
Best for: Product teams with mature data practices who need deep behavioral analysis and want to run experiments alongside their analytics. The AI features add real value once your event taxonomy is clean and your data volume is high enough to surface patterns automatically.
Mixpanel
Mixpanel specializes in flexible event-based querying. Its funnel and retention reports are among the most configurable in the market, and its cohort analysis lets you slice user behavior by almost any property combination. The free tier is generous for early-stage teams.
Best for: Growth and product teams who spend most of their time in conversion funnels and retention curves. Mixpanel’s query flexibility is its real differentiator over Amplitude for teams that need ad-hoc analysis rather than pre-built dashboards.
AppsFlyer
AppsFlyer handles multi-touch attribution, deep linking, fraud protection, and ROI reporting across a wide range of ad network integrations. It is not a product analytics tool. Its job is to tell you which campaigns drove installs and revenue, not what users did after they opened the app.
Best for: Marketing and user acquisition teams running paid campaigns across multiple networks. Pair it with a product analytics tool for full-funnel visibility.
PostHog
PostHog bundles product analytics, session replay, feature flags, and A/B testing into one platform with a self-hosting option. Its free tier covers 1 million events per month. The open-source codebase means you can inspect and extend the platform, which matters for teams with strict data governance requirements.
Best for: Developer-led teams that want one tool covering analytics, experimentation, and session replay without vendor lock-in. The self-hosting option makes it a strong candidate for teams navigating GDPR/CCPA compliance.
UXCam
UXCam captures gesture-level session data on mobile: swipes, pinches, rage-taps, and scroll depth. Generic web replay tools miss this entirely. Its heatmaps and session recordings are built specifically for touch interfaces, making it the go-to for mobile UX debugging.
Best for: UX and product teams investigating specific friction points in mobile flows. Use it alongside a product analytics tool, not instead of one.
Sentry
Sentry focuses on crash reporting and error monitoring with enough context to actually debug the problem: full stack traces, breadcrumb trails, release health metrics, and performance monitoring. It supports self-hosting for teams that need data residency control.
Best for: Engineering teams who need to catch regressions before users report them. Sentry’s release health dashboard is particularly useful for teams shipping frequently.
Countly
Countly offers a self-hosted Community Edition that gives teams complete control over their data. It covers events, funnels, retention, push notifications, and crash reporting. The Enterprise Edition adds compliance tooling and dedicated support.
Best for: Privacy-first teams and regulated industries (healthcare, finance) where sending user data to a third-party cloud is not acceptable. Self-hosting eliminates the compliance overhead of sharing identifiers with external vendors.
Other tools at a glance
CleverTap adds multichannel campaign automation (push, email, SMS, in-app) on top of behavioral analytics, making it the right choice for engagement-focused growth teams. Firebase Analytics is the free baseline most teams start with; its BigQuery export is genuinely powerful for custom analysis once your data volume justifies it. RevenueCat is the standard for subscription analytics, covering MRR, churn, and paywall A/B testing with clean integrations into Amplitude and AppsFlyer.
For ASO-specific intelligence: AppTweak and MobileAction both offer deep keyword research and competitor monitoring. Appfigures and AppBot focus on store reporting and review analysis. App Radar and AppRadar cover keyword rank tracking and listing management. Astro provides category-level competitive intelligence. Userpilot is the specialist for in-app onboarding and feature adoption flows. Adobe Analytics serves enterprise teams already embedded in the Adobe Experience Cloud. Facebook Analytics for Apps was discontinued and replaced by Meta Events Manager.
Pro Tip: Don’t instrument everything at launch. Define your top five user actions (activation event, first key action, retention trigger, conversion, and churn signal) and instrument those first. A clean, minimal event taxonomy is easier to maintain and produces more reliable cohort data than a sprawling schema built in a hurry.
How do you choose the right app analytics tool?
The right tool depends on your primary job-to-be-done. Netpeak’s comparison makes this point clearly: product analytics and marketing attribution are different jobs, and combining both in one vendor often means compromising on depth in one area. Most mature teams run a product analytics tool alongside a dedicated MMP.
Evaluation criteria to work through
Event model: Does the tool support a fully custom event schema, or does it impose a fixed session structure? Event-based tools give you more flexibility for cohort analysis and long-term retention tracking.
Identity strategy: How does the tool handle anonymous-to-known user stitching? Poor identity resolution inflates your user counts and breaks funnel accuracy.
SDK size and performance: A heavy SDK increases app binary size and can affect load time. Check the SDK’s impact on your build before committing.
Offline buffering: Does the SDK queue events when the device is offline and flush them on reconnect? This matters for apps used in low-connectivity environments.
Raw data export: Can you export raw events to BigQuery, Snowflake, or S3? Without raw export, you are locked into the vendor’s query interface for any custom analysis.
Data retention policy: How long does the vendor retain raw event data? Some free tiers retain only 90 days, which breaks long-term cohort analysis.
Attribution needs: If you run paid campaigns, you need an MMP. Product analytics tools do not replace attribution.
Session replay: If you need gesture-level mobile replay, use a mobile-first tool like UXCam. Generic web replay tools do not capture touch interactions accurately.
Privacy and compliance: If your users are in the EU or California, GDPR and CCPA apply. Self-hosted options like Countly or PostHog give you direct control over identifiers and retention.
Integration depth: Check whether the tool connects to your ad networks, CDP, and data warehouse natively, or whether you need a middleware layer.
Questions to ask vendors during a trial
What is the SDK size impact on iOS and Android builds?
How is user identity resolved across sessions and devices?
What happens to my data if I cancel? Can I export everything?
Are there data volume overages, and at what threshold do they kick in?
How long is raw event data retained on your free and paid tiers?
Is there a dedicated mobile SDK with offline buffering?
Red flags to watch for
Opaque pricing with no published tiers (common in enterprise tools)
No raw data export option on any paid tier
SDK last updated more than 12 months ago
No documented GDPR/CCPA data processing agreement
Retention analytics locked behind the highest pricing tier
Pro Tip: Run a two-week instrumentation spike before committing to any paid plan. Instrument your five core events, build one funnel, and check whether the data matches your backend counts. A 10–15% discrepancy is normal; anything higher signals an SDK or identity problem worth fixing before you scale.
What are the trade-offs between product analytics, attribution, and session replay?
These are distinct feature categories that solve different problems. Mixing them up leads to buying the wrong tool or expecting one platform to do a job it was not built for.
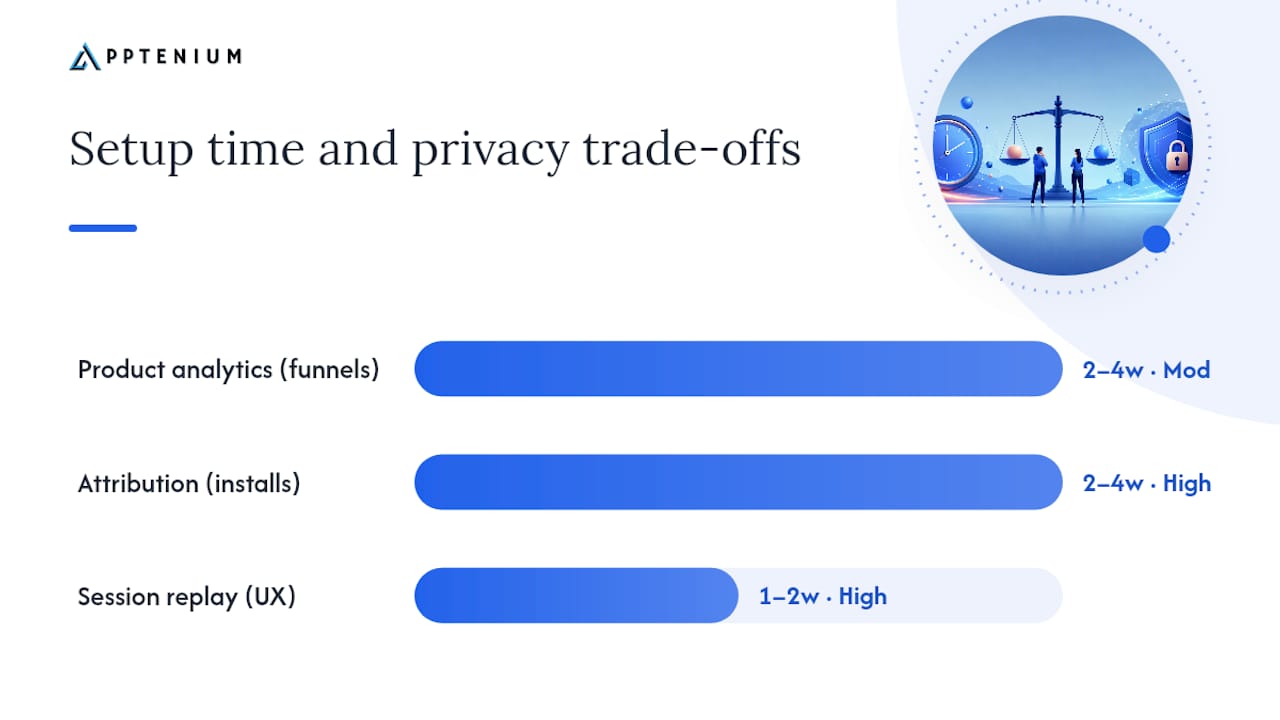
Feature CategoryPrimary Use CaseImplementation CostPrivacy ConsiderationProduct analytics (event-based)Funnels, retention, cohort analysisMedium (2–4 weeks for basic setup)Moderate — user IDs and behavioral events sent to vendorMarketing attribution (MMP)Campaign ROI, install source, deep linkingMedium (2–4 weeks + ad network setup)High — device identifiers (IDFA/GAID) shared with vendorSession replay (mobile-first)UX debugging, gesture analysis, friction detectionLow–Medium (1–2 weeks)High — screen content may capture PII if not maskedCrash and error reportingStability monitoring, regression detectionLow (1–3 days)Low — stack traces rarely contain PIIASO analyticsKeyword rank, listing conversion, competitor trackingLow (hours to days)Low — store metadata, no user PIIRevenue and subscription analyticsMRR, churn, paywall performanceLow–Medium (1–2 weeks)Moderate — purchase events and user IDs
Event-based vs. session-based models:
Event-based tools record every discrete user action as a timestamped event with properties. This gives you the flexibility to build any funnel, cohort, or retention query after the fact, as long as the events were instrumented. The trade-off is instrumentation overhead: you need to define and maintain your event schema, and a poorly designed schema produces unreliable data.
Session-based tools group activity into sessions with start/end timestamps and aggregate metrics like session length and screen views. They are easier to set up and interpret, but they limit your ability to run custom cohort queries or track specific behavioral sequences across sessions.
For long-term retention analysis and cohort-level product decisions, event-based wins. For quick baseline metrics and crash context, session-based or hybrid tools are faster to implement.
Privacy trade-offs in practice:
Attribution tools carry the highest privacy risk because they rely on device identifiers (IDFA on iOS, GAID on Android) to match installs to campaigns. Apple’s App Tracking Transparency framework has reduced IDFA availability significantly, which is why probabilistic attribution and SKAdNetwork modeling have become standard in the U.S. market. Session replay tools require careful PII masking configuration to avoid capturing sensitive screen content. Self-hosted options like Countly and PostHog reduce third-party data sharing, which simplifies your GDPR/CCPA data processing obligations.
Why ASO-linked analytics give you a signal most tools miss
Most product analytics tools start measuring after the install. That means they miss the entire acquisition funnel: keyword impressions, store listing conversion rate, and the relationship between your listing quality and your download volume. When you separate ASO from analytics, you lose the ability to connect a keyword ranking change to a downstream shift in activation rate or revenue.
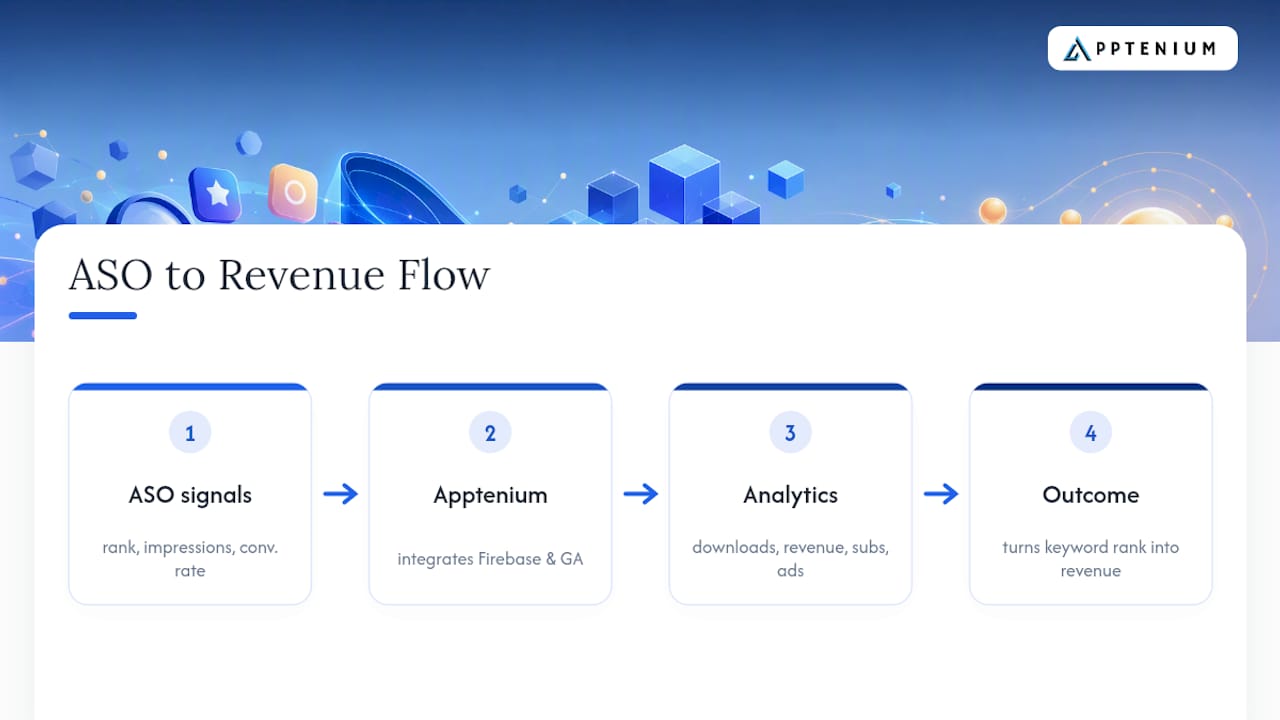
Apptenium closes that gap. By integrating ASO signals (keyword rank, impressions, listing conversion rate) with analytics signals (downloads, revenue, subscriptions, ad monetization), it lets you see which listing changes actually moved the needle on installs and which installs converted to paying users. The platform’s direct integrations with Firebase and Google Analytics mean you are not manually reconciling data from three separate dashboards.
Connecting your app store keyword rank to your Firebase activation funnel is the kind of signal that changes how you prioritize listing updates. A keyword driving high-volume installs with low activation rates tells you the listing is attracting the wrong audience — that insight is invisible if your ASO tool and your analytics tool never talk to each other.
The top apps performance data Apptenium surfaces gives you a competitive benchmark: you can see how your download and revenue trends compare to category leaders, not just your own historical data.
Pro Tip: When you connect Firebase to Apptenium, map your Firebase activation event to your primary ASO conversion goal. That single connection turns keyword rank data from a vanity metric into a revenue signal.
The U.S. market is converging on event-based analytics plus dedicated attribution
The clearest trend in U.S. mobile teams right now is consolidation around two-tool stacks: an event-based product analytics platform for behavioral analysis and a dedicated MMP for attribution. Teams that tried to do both in one vendor often found they were compromising on depth in one area or paying significantly more for features they only partially used.
Privacy is the second major force reshaping tool selection. The combination of Apple’s ATT framework, CCPA enforcement in California, and growing enterprise interest in data residency has pushed more U.S. teams toward self-hosted or private-cloud options than at any point in the past five years. Countly and PostHog are the most commonly cited beneficiaries of that shift. For teams that cannot self-host but still need compliance documentation, the key question is whether the vendor offers a signed data processing agreement and documented data retention policies — not just a privacy policy page.
Apptenium connects your ASO and analytics in one place
Most teams running paid acquisition and organic ASO are managing at least three separate dashboards: their app store console, a product analytics tool, and an attribution platform. Apptenium replaces that fragmentation for teams whose primary growth lever is organic search visibility and listing optimization.
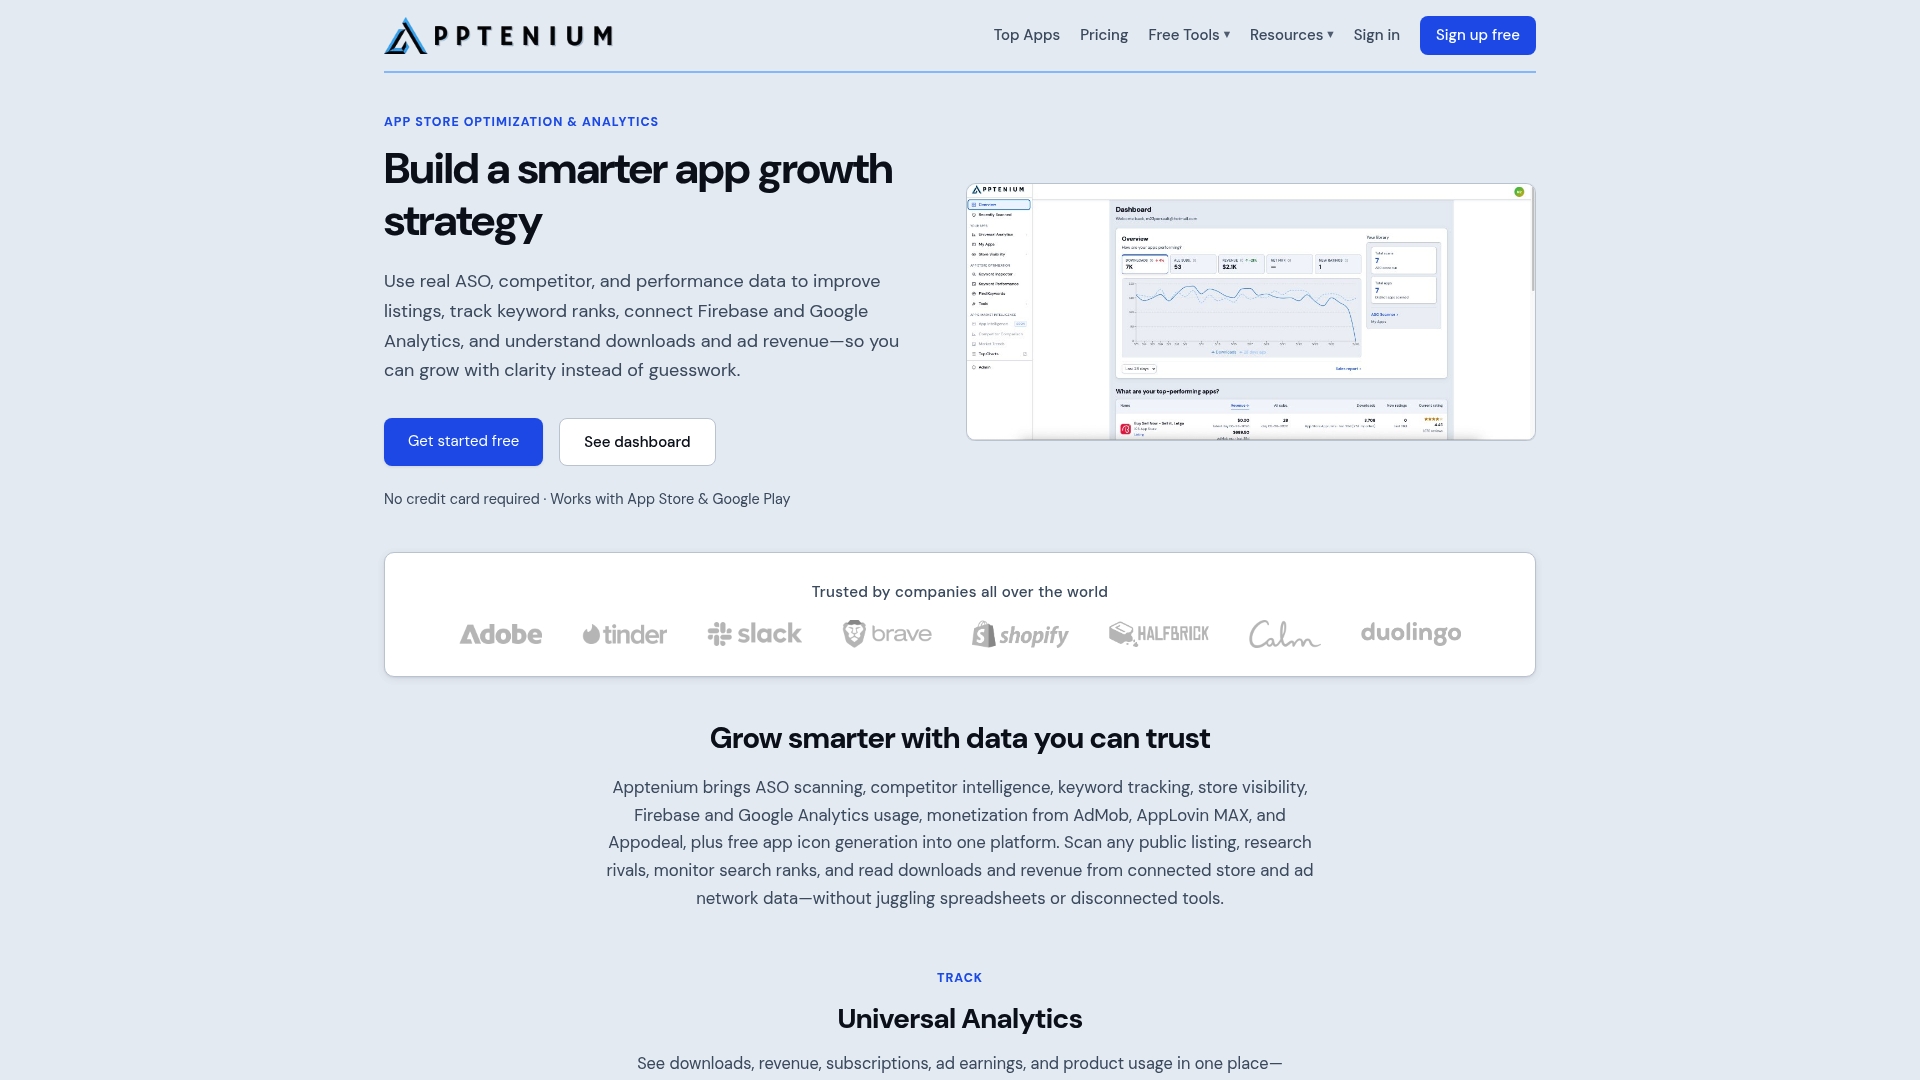
The path from trial to value is short. Connect your app store accounts, link Firebase or Google Analytics, and Apptenium surfaces AI-powered recommendations for your listing alongside download and revenue data in a single view. You get keyword tracking, competitor intelligence, ASO scanning, and performance reporting without the overhead of stitching together separate tools. For teams serious about organic growth, that integration is the practical advantage.
Start with Apptenium’s free tier to scan your listing and see your keyword gaps, then upgrade when you need unlimited scans and full AI recommendations. Try Apptenium and connect your first app in under an hour.
Sources
Amplitude | A new era for product teams
The 7 best mobile app analytics tools
Mobile App Analytics Tool Comparison: Choosing the Best for Your Goals and Objectives
FAQ
What is the best free app analytics tool?
Firebase Analytics (Google Analytics for Firebase) is the most widely used free option, covering up to 500 distinct event types with no seat limits and a BigQuery export path for custom analysis. PostHog’s free tier covers 1 million events per month and includes session replay and feature flags.
Do I need both a product analytics tool and an attribution platform?
For most teams running paid user acquisition, yes. Product analytics tools track what users do after install; attribution platforms (like AppsFlyer) track which campaigns drove the install. They answer different questions and are not interchangeable.
Which app analytics tools support self-hosting?
Countly and PostHog both offer self-hosted deployments. Sentry also supports self-hosting for crash reporting. Self-hosting gives you direct control over data retention and user identifiers, which simplifies GDPR and CCPA compliance.
How long does it take to implement an app analytics tool?
Basic event instrumentation and dashboards typically take 2–4 weeks. Advanced funnels, cohort definitions, and raw data export to a warehouse usually require 6 or more weeks and need both product and engineering involvement.
What makes Apptenium different from other analytics tools?
Apptenium combines ASO keyword tracking, AI-powered listing recommendations, and app performance analytics (downloads, revenue, subscriptions) in one platform, with direct integrations into Firebase and Google Analytics. Most product analytics tools start measuring after the install; Apptenium connects store visibility signals to downstream performance data.