Cross App Performance Reporting: 5 Steps to Prove ASO Impact

Cross App Performance Reporting: 5 Steps to Prove ASO Impact
Cross-app performance reporting unifies store, analytics and ad-network data to measure how discovery drives quality outcomes for app store optimization. A defensible setup rests on five things: a metric dictionary, stable keys, source exports, normalized events and revenue, and documented reconciliation. Platforms such as Apptenium package much of this workflow for teams that would rather not build it from scratch.
TL;DR:
- Cross-app performance reporting should incorporate stable keys and consistent dimensions to accurately link discovery, acquisition, engagement, and monetization metrics.
- Data ingestion involves pulling raw exports from App Store and Play Console on different schedules, archiving them, and then normalizing before analysis, which requires a buffer for timing variances.
- Privacy and revenue estimates, especially from AdMob, require tagging and transparency to reflect that some figures are provisional or estimates rather than final.
- Implementing a five-step reconciliation process—including defining metrics, assigning stable identifiers, and documenting attribution models—ensures reliable, repeatable reports.
- Using platforms like Apptenium can streamline this workflow by integrating data sources and maintaining provenance and reconciliation information within dashboards.
Table of Contents
- Core metrics and dimensions every unified cross-app report needs
- Data sources, exports and ingestion patterns
- Privacy, attribution and ad-revenue caveats to design for
- Practical reconciliation and reporting rules: a five-step guardrail
- Author perspective: why unified reporting changes ASO conversations
- How Apptenium implements these guardrails and next steps
- FAQ
- Sources
Core metrics and dimensions every unified cross-app report needs
A useful report groups metrics by funnel stage rather than by source system. Discovery metrics (impressions, product page views, conversion rate) tell you whether your listing is earning attention. Acquisition metrics (first-time downloads, reinstalls) tell you whether that attention converts. Engagement metrics (sessions, active devices) and monetization metrics (in-app purchase revenue, subscription status, ad revenue) tell you whether the people you acquired are worth keeping. Stability metrics (crash rate, ANR rate) round things out, since a buggy release can quietly erase gains from a strong listing update.
None of these numbers mean much without consistent dimensions to join them on. According to App Store Connect’s analytics overview, useful reporting dimensions include app, platform, country, acquisition source, campaign, product or SKU, and subscription state, the same categories Firebase uses to add behavioral context.
Your schema should include:
- App or package name, platform (iOS, Android), and country or region.
- Acquisition source, campaign identifier or UTM parameters, and product or SKU.
- Subscription state, ad source or mediation group, timezone, currency, and reporting period.
These dimensions matter because they let you trace a listing change back to downstream outcomes. If you update your screenshots and installs rise but paying users and subscription conversion do not move, the listing edit improved discovery without improving quality, a distinction ASO work depends on.
Data sources, exports and ingestion patterns
Four systems supply nearly everything a cross-app report needs. App Store Connect’s Analytics Reports API and dashboard cover impressions, product page views, downloads and conversion. Play Console’s store performance and financial reports export acquisition channel, country and store listing conversion fields in CSV form. Firebase and GA4 capture in-app events and can stream raw data to BigQuery for high-fidelity joins. Ad networks, led by AdMob with its mediation estimates, round out the monetization side.
A workable ingestion pattern looks like this:
- Pull raw exports on a schedule (daily for Play Console’s rolling reports, monthly for App Store Connect bulk exports) and archive every file as received, unedited.
- Load archived files into a central warehouse, BigQuery’s export overview describes a common pattern for raw-event storage that supports complex joins later.
- Build normalized staging tables that map each source’s fields to your shared metric dictionary before any dashboard touches the data.
Timing varies by source, and that variance causes most reconciliation headaches. Play Console refreshes some store metrics daily but finalizes financial reports monthly. App Store Connect’s bulk exports arrive in batches rather than streaming continuously. BigQuery queries raw events quickly, but the underlying event data still depends on when each SDK flushed its logs. Build a few days of buffer into any report that claims to be final.
Privacy, attribution and ad-revenue caveats to design for
Apple’s App Store privacy and data use guidance requires App Tracking Transparency consent before identifiers can be used to join app data with third parties for advertising measurement, and low-volume rows are commonly removed through aggregation thresholds. That means some user-level joins you want to make simply will not be available, legally or technically, and your schema needs a way to say so rather than silently dropping rows.

Ad revenue carries its own uncertainty. According to AdMob’s documentation on estimated earnings, AdMob’s reported figures are estimates subject to month-end verification, and mediation revenue is calculated proportionally rather than measured impression by impression, which is why AdMob, Firebase and Play reports can show different numbers for what looks like the same revenue.
Design around these realities rather than against them:
- Store consent and attenuation metadata alongside every dataset, not in a separate compliance document.
- Tag every revenue row as estimated or finalized, and keep the two separate in dashboards.
- Add provenance columns noting source system and export timestamp for every table.
Practical reconciliation and reporting rules: a five-step guardrail
A compact five-step process keeps cross-app reports honest and repeatable.
- Define a metric dictionary. Write precise definitions for every metric, including whether revenue is gross or net, which currency it is stated in, and which timezone a “day” refers to.
- Assign stable keys. Settle on canonical identifiers for app or package name, platform, country and campaign, and normalize UTM sources so “google” and “Google” never appear as two different acquisition channels.
- Ingest and archive. Pull App Store Connect and Play Console exports, Firebase or GA4’s BigQuery export, and ad network reports, and keep the raw files for audit even after they are normalized.
- Normalize events and revenue. Standardize ad_impression parameters, currency formatting and ad source labels so a dollar from one network looks like a dollar from another before it hits your dashboard.
- Reconcile and publish. Document your attribution model, data freshness, aggregation thresholds and reconciliation status directly on the dashboard, not in a separate memo nobody reads.
Pro Tip: Run the five-step process in a staging environment against one app for a full reporting cycle before rolling it out across your portfolio: discrepancies show up fast once you compare staging output against the original exports.
Author perspective: why unified reporting changes ASO conversations
The most common failure we see is not bad data, it is treating an estimate as a final number and comparing it to a definition nobody wrote down. Once provenance and reconciliation status sit on the dashboard itself, ASO conversations shift from arguing about which number is right to deciding which listing change actually moved paying users or subscription conversion. Build the five-step guardrail in staging first. Rushing straight to production is how teams end up debugging a dashboard instead of a listing.
— Mike
How Apptenium implements these guardrails and next steps
We built Apptenium around this same structure, so you do not have to assemble a metric dictionary, ingestion pipeline and reconciliation layer from separate tools. Some platforms pull together ASO scanning, competitor intelligence and keyword tracking with performance reporting across downloads, revenue, subscriptions and ad monetization, integrating directly with Firebase and Google Analytics so acquisition and monetization data sit next to your listing data instead of in a separate spreadsheet.
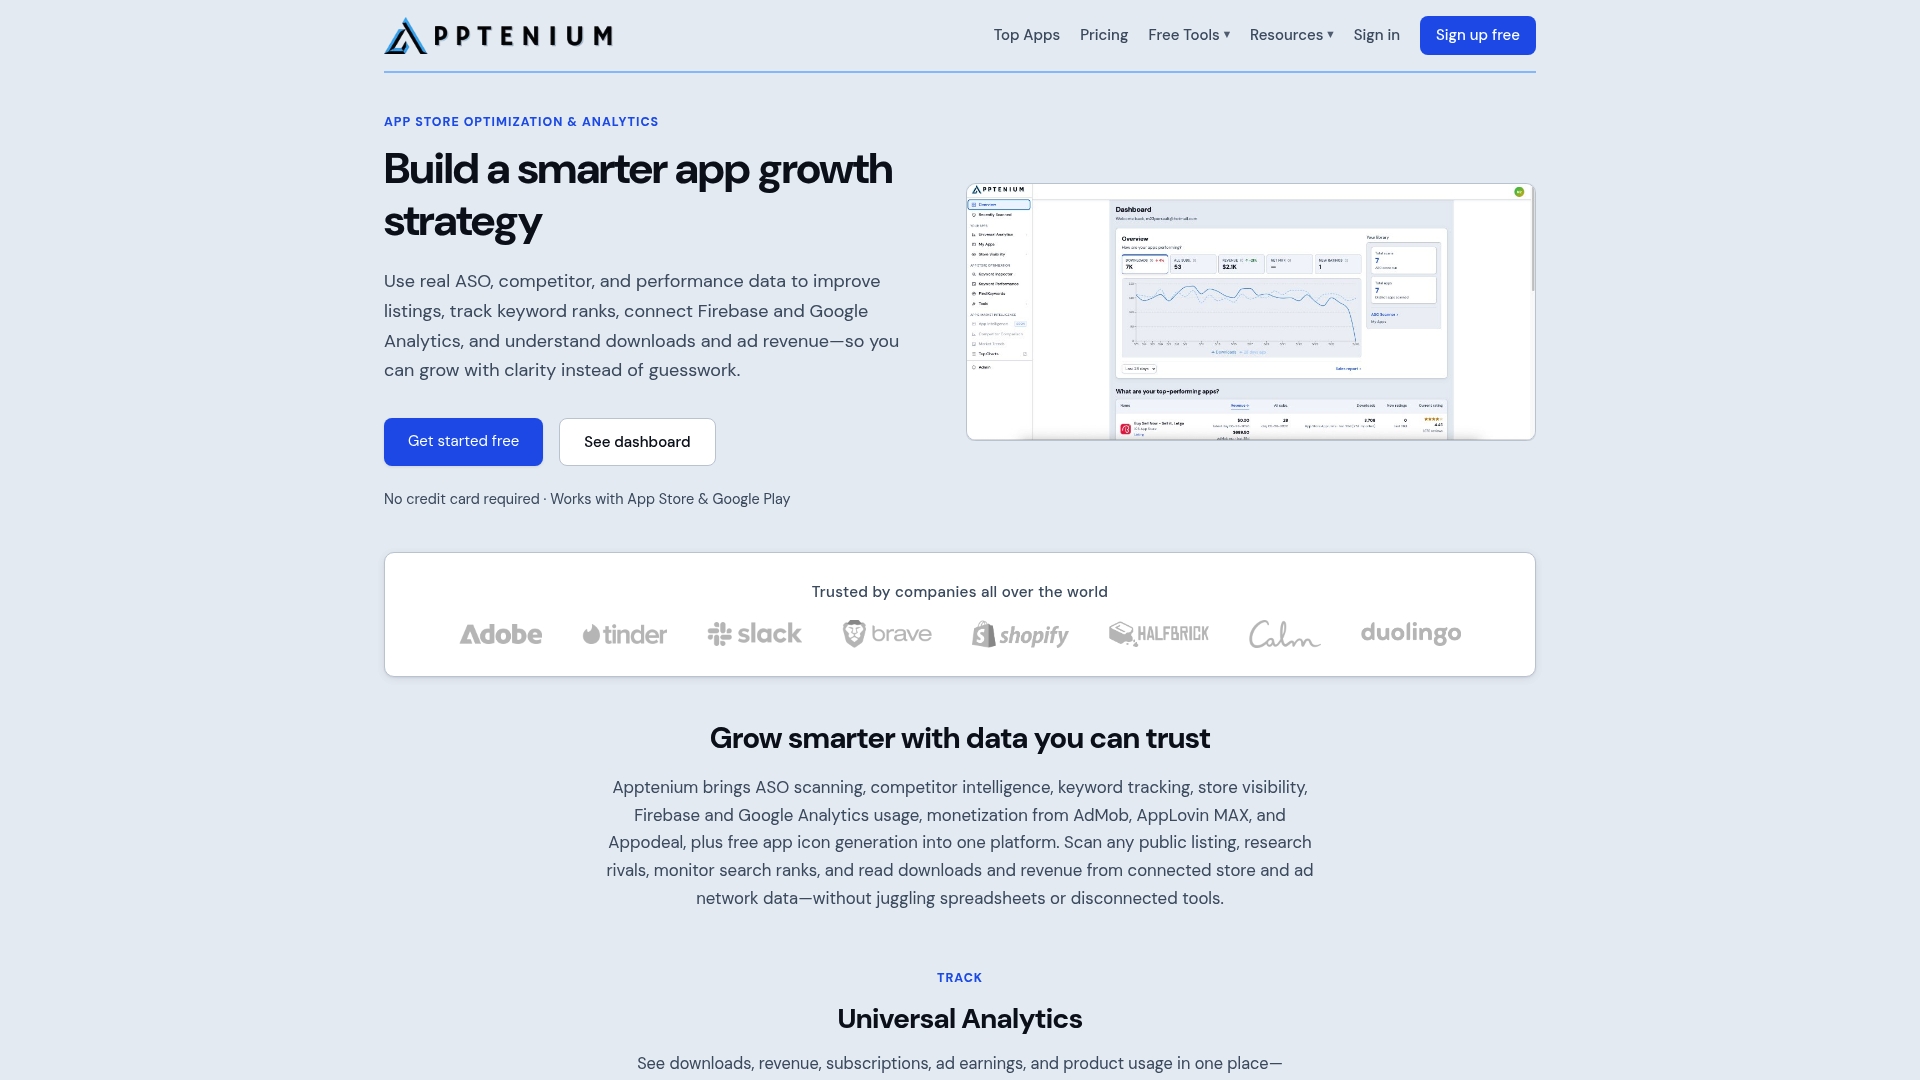
- Recommendations turn scan results into copy-ready listing fixes instead of raw diagnostics.
- Integrations with major ad and analytics platforms keep revenue and engagement data in the same view as your keyword rankings.
- Real-time monitoring replaces fragmented, multi-tool setups some teams use.
| Plan | Price | Best for |
|---|---|---|
| Free | No published price | Testing scans on a limited monthly basis |
| Pro | See the pricing page | Unlimited scans and premium reporting features |
Visit our pricing page to compare the Free and Pro plans and start unifying your reporting today.
FAQ
What is cross-app performance reporting in ASO?
Cross-app performance reporting combines store analytics, in-app event data and ad-network revenue into one view so you can trace discovery metrics like impressions and conversion rate through to quality outcomes like paying users and subscription revenue. It typically pulls from App Store Connect, Play Console, Firebase or GA4, and ad networks.
Why do AdMob and Firebase show different revenue numbers?
AdMob’s reported earnings are estimates subject to month-end verification, and revenue from mediated ad sources is calculated proportionally rather than measured per impression, according to AdMob’s own documentation. Firebase’s Estimated Revenue metric only accounts for AdMob Network ads, so other mediation sources need to be logged separately to appear accurately.
How does App Tracking Transparency affect cross-app joins?
Apple requires App Tracking Transparency consent before identifiers can be used to join app data with third parties for advertising measurement, as described in Apple’s privacy and data use guidance. Without that consent, or where aggregation thresholds remove low-volume rows, some user-level joins are not available, and reports should flag that gap rather than approximate it.
What tool can unify ASO and performance reporting in one place?
Apptenium combines ASO scanning, competitor intelligence, keyword tracking and performance reporting with integrations into Firebase and Google Analytics, so listing work and monetization data live in one platform. Plans include a Free tier and a Pro tier at $9.99 per month.
How often should I refresh cross-app performance dashboards?
Refresh cadence should match your slowest reliable source rather than your fastest one. Play Console refreshes some store metrics daily but finalizes financial reports monthly, according to Google’s Play Console reporting documentation, so a monthly reconciliation pass keeps dashboards from flagging normal batching delays as data errors.