ASO Keyword Trend Analysis: Your 2026 App Growth Playbook

Run a weekly, instrumented keyword trend scan that connects store rankings to impressions, product-page conversion, and Day-1/Day-7 retention — then act on what you find. That single habit separates apps that compound organic growth from those that plateau.
Enable automated rank alerts on your primary money terms
Flag any keyword that moves 3+ positions on a high-volume term
Run one metadata or creative experiment per confirmed signal
The core principle: keyword rank is an observation, not a result. Pair every rank move with impressions, conversion, and retention data before you act — otherwise you’re optimizing for a metric that doesn’t pay the bills.
Table of Contents
What does keyword trend analysis actually mean for ASO?
In the App Store and Google Play context, keyword trend analysis means tracking how keyword popularity, rankings, impressions, and competition shift over time — specifically within those two stores for the United States market. It is not web search research. Google Trends and Google Keyword Planner measure web query volume; what you need is store-native data.
Scope boundary: ASO keyword trend analysis covers title, subtitle, and keyword-field changes on iOS; description text on Google Play; plus impressions, rankings, conversion, installs, retention, and revenue attributed by keyword — all measured inside App Store Connect, Google Play Console, and connected analytics.
The two stores index content differently. Google Play indexes the full 4,000-character description and applies semantic NLP, so natural descriptive language carries real weight. iOS uses a 100-character hidden keyword field alongside the title and subtitle, and since October 2025, Apple’s Search Popularity scores are only returned for keywords scoring 35 or above. Those structural differences mean your trend analysis workflow must be store-specific, not generic.
Which metrics belong in every weekly trend scan?
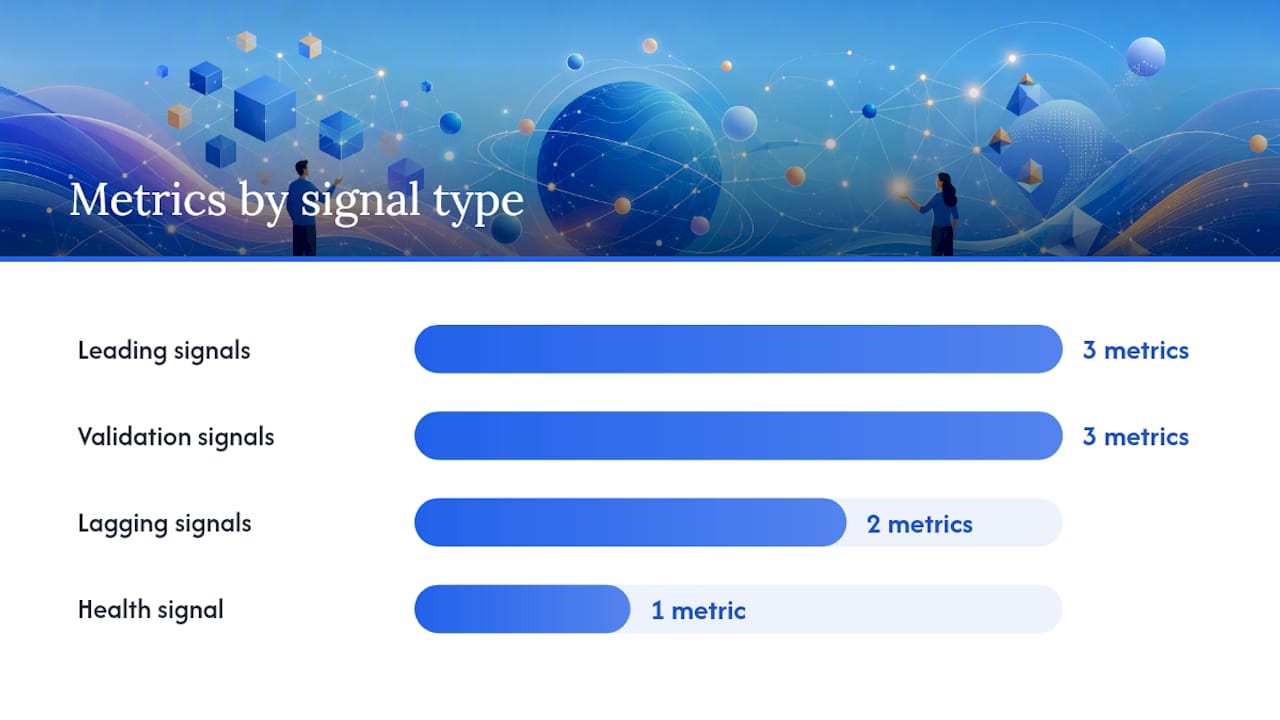
Track a fixed basket of several keywords weekly, weighted by search volume, so you catch problems before download charts reveal them. Here is how the core metrics split between leading and lagging signals:
MetricTypeWhat it tells youKeyword rank (by country)LeadingVisibility shift — first signal of a problem or opportunityImpressionsLeadingConfirms rank change has real traffic impactProduct-page views / TTRLeadingShows whether impressions convert to listing visitsInstall rate / CVRValidationConfirms the traffic is qualifiedDay-1 retentionValidationReveals whether installs match user intentDay-7 retentionValidationMeasures sustained engagement post-installReview velocityLaggingReflects user sentiment after the install waveANR / crash rateHealthGoogle suppresses visibility when ANR crosses a low threshold of daily user impactOrganic downloadsLaggingThe result, not the signal — never lead with this
Retention benchmarks worth keeping in mind: Day-1 and Day-7 levels above commonly accepted thresholds indicate healthy apps. When retention drops below those levels after a metadata change, the keyword you gained traffic from is attracting the wrong audience.
Conversion compounds fast. Improving install rate by several percentage points at a high impression volume adds thousands of installs monthly — without touching rank at all. That math is why CVR belongs in every scan alongside rank data.
Where should you pull your trend data from?
No single source gives you the full picture. You need native consoles, ad platforms, and analytics working together.
Native consoles are your foundation. App Store Connect provides impressions, product-page views, and the conversion funnel by source type. Google Play Console surfaces install counts, store listing performance, and technical vitals. Neither gives you historical rank data or cross-market comparisons out of the box.
Apple Search Ads fills a critical gap. Use Search Match for discovery, broad match to capture emerging trends, and then move high-performing terms into exact match for brand or category campaigns. ASA search term reports show you which queries actually convert — that validated data is more reliable than volume estimates alone.
Firebase and Google Analytics let you attribute installs back to acquisition source and measure activation and retention by cohort. When you connect analytics to your keyword data, you can see whether a rank gain on a specific term is driving users who actually complete onboarding.
The fragmentation problem: most teams run App Store Connect in one tab, Play Console in another, Firebase in a third, and a spreadsheet for rank tracking. That setup guarantees you’ll miss the moment a rank move and a retention drop happen simultaneously.
Pro Tip: Apptenium consolidates ASO scanning, keyword tracking, competitor intelligence, and analytics integrations — connecting App Store Connect, Apple Search Ads, Google Play Console, Firebase, and Google Analytics into one view so you can correlate rank moves with retention drops without switching tools.
What action should you take for each trend signal?
Different signals call for different responses. This matrix maps the most common patterns to prioritized actions.
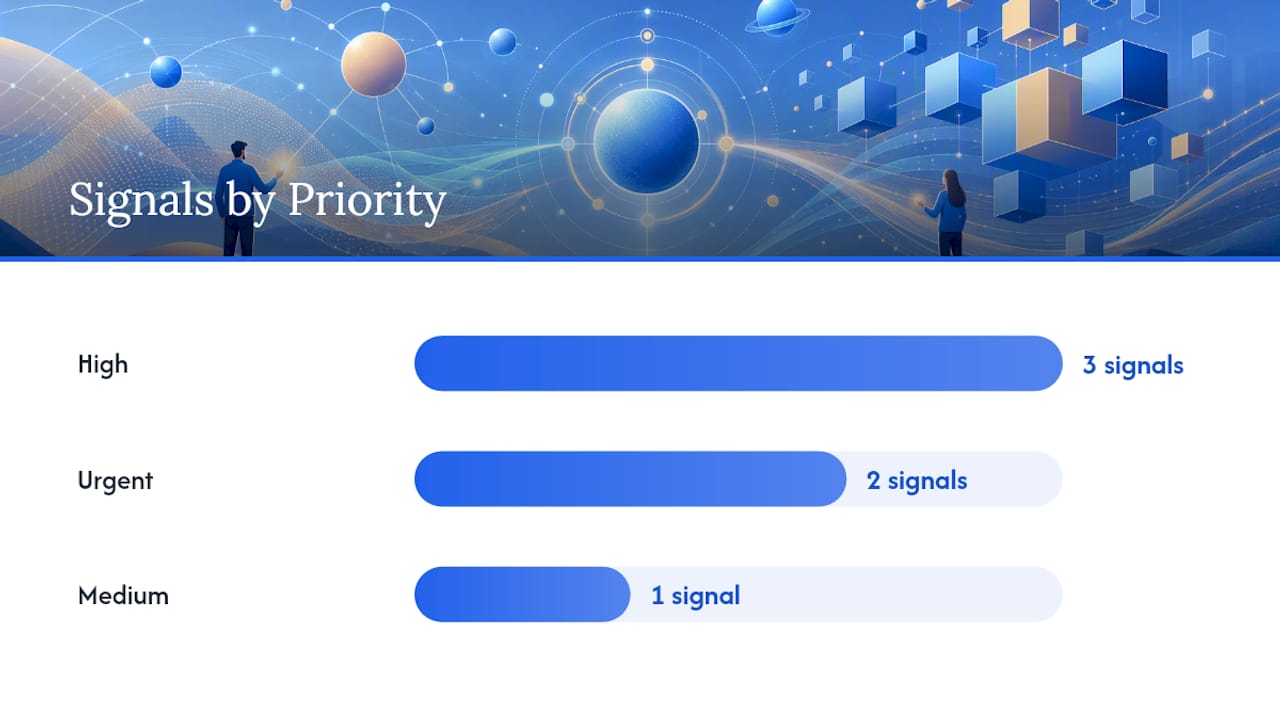
SignalPriorityActionHigh-volume rank drop + impressions downUrgentCheck ratings, screenshots, and ASA coverage; investigate competitor changesRank up + conversion downHighCreative experiment: icon, first two screenshots, preview videoNew high-volume term found via ASAHighAdd to metadata + run creative test for that intentImpression drop, rank stableMediumCheck featuring events, paid cannibalization, or seasonal shiftRetention drop after releaseHighOnboarding fix or revert metadata if intent mismatch is confirmedANR above 0.47% on Google PlayUrgentProduct fix before any metadata work — vitals suppress visibility
A few principles that cut across all signals:
Focus on signals that affect your money-term-weighted share of voice — one #1 rank on a low-volume term matters less than holding top-5 across your full basket.
Never optimize for a high-volume term you can’t convert. Rank gains on mismatched terms inflate impressions while hurting CVR and retention simultaneously.
Annotate your timeline with every paid campaign, featuring event, and release. Without annotations, rank moves look like organic wins when they’re not.
How often should you check, and what thresholds trigger action?
CadenceWhat to reviewDaily (automated alerts)Rank regressions on top-5-volume keywords, rating drops, ANR spikesWeeklyFull keyword basket, impressions trend, CVR by keyword, retention cohortsMonthlyShare of voice across basket, retention cohort analysis, keyword rotationQuarterlyMetadata refresh planning, seasonal keyword strategy, locale expansion
Alert thresholds worth setting now:
3+ position drop on any top-5-volume keyword
20% week-over-week impressions drop paired with falling rank
Day-1 retention below 35% or Day-7 below 15% after a release
ANR rate above 0.47% on Google Play
Dashboard structure: your weekly view should show the top 15–30 keyword basket, impressions trend, CVR by keyword, retention cohorts, and metadata/release changes annotated on the timeline. Pairing rank tracking with product-page conversion and retention is what turns a rank report into a decision-making tool.
Share of voice — the percentage of impressions across your keyword basket that go to your app versus competitors — is a stronger dominance metric than any single ranking, especially where ads sit between organic results.
Key Takeaways
Weekly ASO keyword trend analysis works when you connect rank movement to impressions, conversion, and retention — not when you track rank in isolation.
PointDetailsTrack 15–30 keywords weeklyWeight by volume; leading indicators catch problems before download charts move.Pair rank with CVR and retentionA rank gain that drops Day-1 retention below 35% signals an intent mismatch, not a win.Set daily automated alertsTrigger on 3+ position drops, 20% impressions declines, and ANR above 0.47% on Google Play.Validate terms before metadataRun a 2-week Search Match campaign; only promote converting terms into organic keyword fields.Use Apptenium to consolidate signalsApptenium connects App Store Connect, Google Play Console, Firebase, and Google Analytics to automate alerts and surface AI-powered keyword opportunities in one view.
An ASO practitioner’s honest take on keyword trend analysis
The part most teams skip is the annotation layer. You can have perfect rank tracking and still make the wrong call if you don’t know that a competitor got featured the same week your rank dropped, or that your paid UA campaign inflated install velocity and temporarily boosted organic rank. The signal looks like organic momentum; it isn’t.
My weekly workflow takes about 10 minutes: check the alert queue for rank regressions and retention flags, scan the keyword basket for any 3+ position moves, cross-reference impressions and CVR for the same period, and decide whether the signal warrants an experiment or just a note in the timeline. The experiments that actually move installs are almost always creative changes — icon and first two screenshots — not keyword-field edits. Keyword work opens the door; creative work gets users through it.
The teams I see stall are the ones optimizing for rank on terms they can’t convert. They climb to position 3 on a high-volume keyword, impressions go up, installs barely move, and they can’t figure out why. The answer is almost always in the CVR data they weren’t watching.
How Apptenium fits into your keyword trend workflow
Most ASO teams spend more time moving data between tools than actually analyzing it. Apptenium closes that gap by connecting App Store Connect, Apple Search Ads, Google Play Console, Firebase, and Google Analytics into a single platform — so rank moves, impression shifts, CVR changes, and retention cohorts appear in one view rather than four.
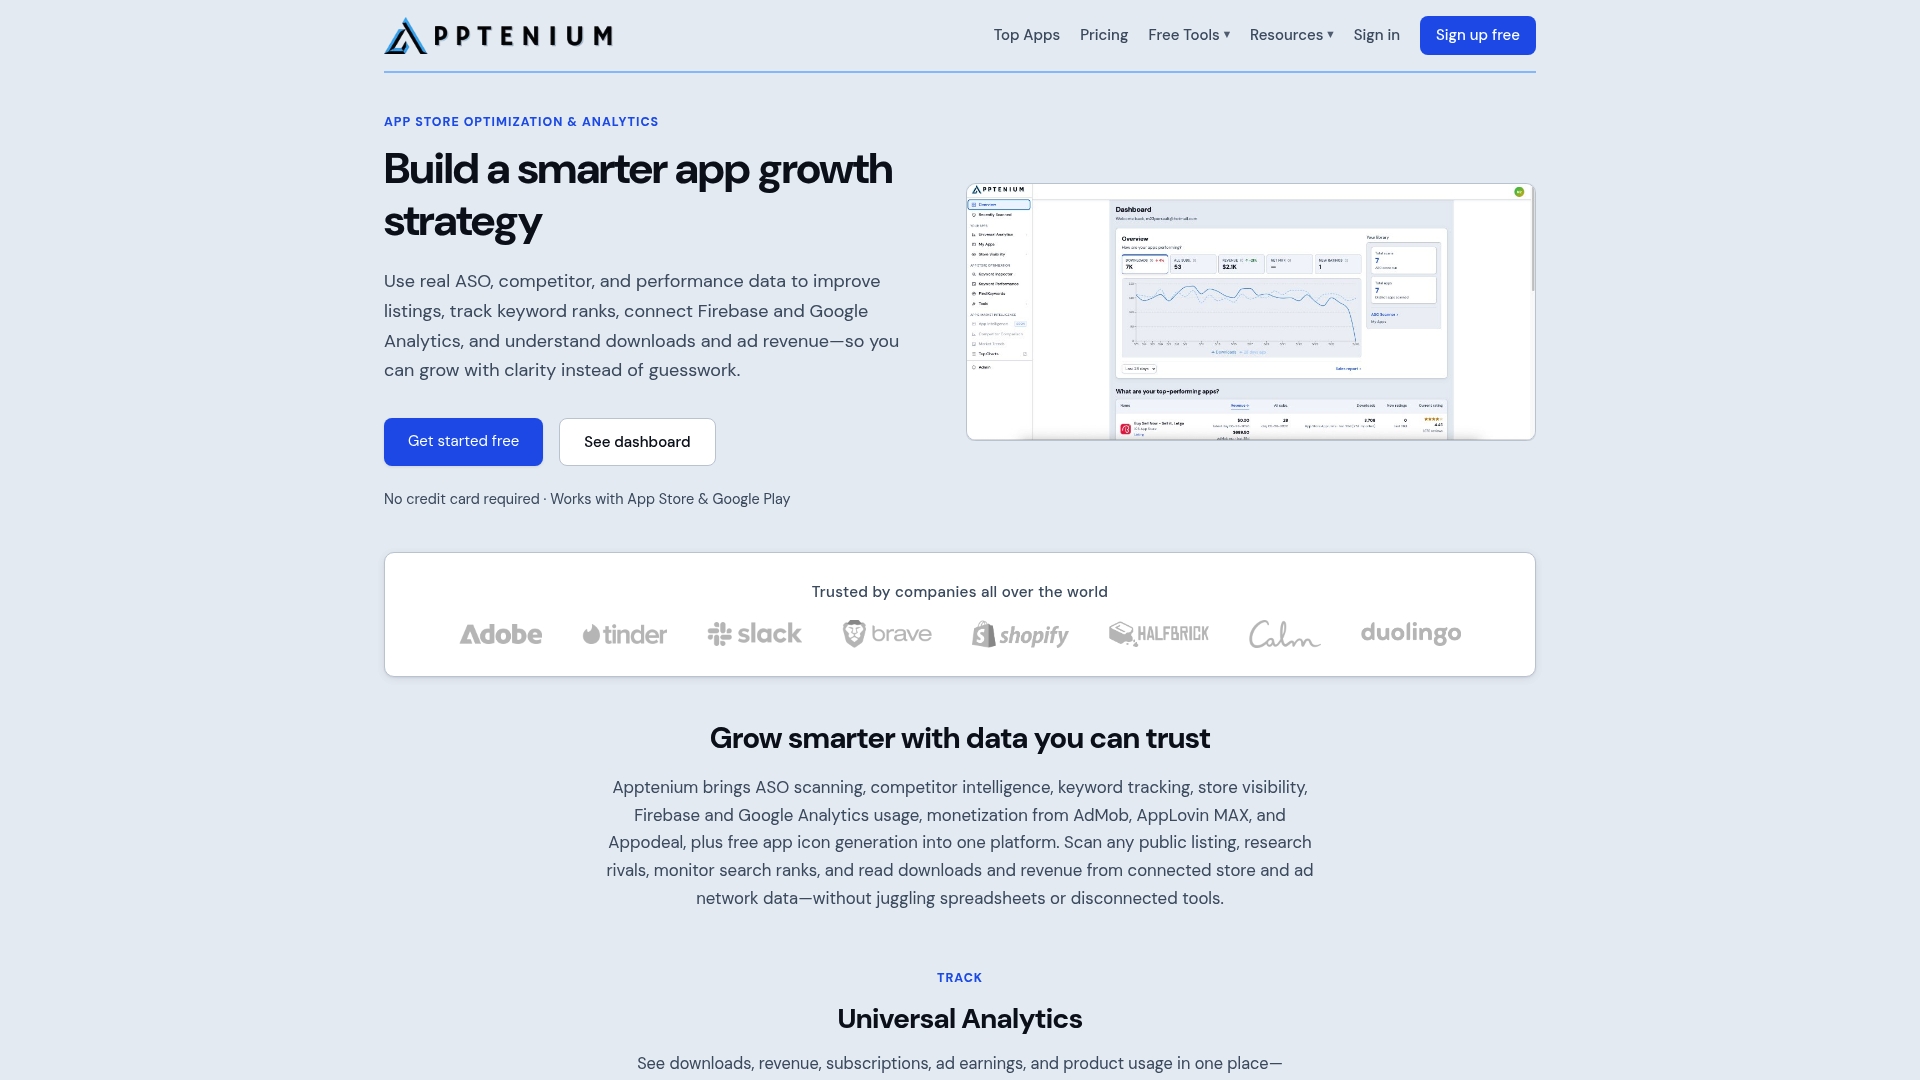
The platform runs continuous rank tracking with automated alerts for the thresholds that matter: rank regressions, impression drops, CVR declines, and retention flags. Its AI-powered keyword opportunity scoring surfaces terms worth testing before competitors find them. Creative experiment tracking lets you annotate metadata and screenshot changes directly on the performance timeline, so you can actually attribute what moved the needle.
Apptenium’s free tier gives you limited scans to start; the paid tier unlocks unlimited scans, full alert automation, and premium competitor intelligence. Start your first free ASO scan and connect your analytics in minutes — no spreadsheet required.
Useful sources and further reading
ASO KPIs: The Metrics That Actually Matter in 2026 | AppDrift
ASO Keyword Research: The Complete Guide for 2026 | Sonar Blog
The iOS App Store Keywords Field: A Complete 2026 Guide | AppDrift
ASO Keyword Tracking 2026: Monitor App Store Rankings by Country | AppLaunchFlow
Apptenium — App Store Optimization, App Icon Generator & Analytics