How to Estimate App Downloads With Rank, Ratings, and Vendor Tools

How to Estimate App Downloads With Rank, Ratings, and Vendor Tools
The most reliable way to estimate app downloads is to combine three approaches: rank-to-download curves, rating-velocity proxies, and hybrid vendor or panel tools. No single method gets you an exact number, and you shouldn’t expect one to.
Here’s the honest accuracy picture. Trend estimates (is a competitor growing or shrinking?) tend to be reasonably accurate within a moderate margin of error. Absolute download counts are less precise, and revenue estimates are less reliable because they combine download estimates with average revenue assumptions. AppTweak’s guidance on download and revenue estimates is blunt about this: these are projections for benchmarking, not audited figures.
Your first move should take about two minutes:
- Pull your app’s 30-day rating delta and total rating count from the store listing.
- Run a rating-velocity calculation (covered in detail below) or a one-click scan through a tool like Apptenium’s ASO scanner.
- Compare the output against your own App Store Connect or Google Play Console numbers to see how far off the model runs for your specific app.
That last step matters more than people think. Calibrating against ground truth you already own is what turns a generic estimate into something usable for competitor analysis.
TL;DR:
- Combining rank-to-download curves, rating velocity, and hybrid ad signals yields the most reliable app download estimates, but calibration against known data is essential.
- Estimates are most accurate for trending signals within ±15 to 25%, while absolute counts can vary by 25 to 50%, requiring periodic recalibration every month.
- Using your app’s real download data to calibrate models improves estimate accuracy for competitors, especially when adjusting for category-specific rating-to-download ratios.
- Majority of tools layer signals like rank, ratings, and panel data to produce estimates, and open-source formulas provide transparency for custom calibrations.
- Automating data collection through platforms like Apptenium streamlines estimation workflows and improves benchmarking for growth decisions.
Table of Contents
- What Signals Feed App Download Estimates and Which Tools Use Them
- How Do You Calculate App Download Estimates Yourself?
- How Do You Calibrate Estimates and Set Confidence Bands?
- A Worked Example: Estimating Monthly Downloads From Public Data
- How Should You Use Download Estimates for Growth Decisions?
- Turning These Methods Into an Apptenium Workflow
- Editorial Take: Why Precision Obsession Misses the Point
- Try Apptenium for Faster, More Reliable Estimation Inputs
- Key Takeaways
- Sources
- FAQ
What Signals Feed App Download Estimates and Which Tools Use Them
Every download estimate, no matter how it’s packaged, traces back to a small set of public or semi-public signals. Understanding these signals is what separates a useful estimate from a number pulled out of thin air.
The core signal families:
- Category and overall chart rank — the position an app holds in a store’s top charts, refreshed hourly or daily depending on the store.
- Rating and review velocity — how fast new ratings and reviews accumulate over a rolling window.
- Total rating count — the cumulative volume, useful for lifetime download proxies rather than recent trend.
- Store metadata — release date, size, update frequency, and supported countries, which help scope realistic install ranges.
- Ad-intelligence signals — creative counts, active ad networks, and spend patterns that hint at paid acquisition volume layered on top of organic downloads.
- Panel telemetry — anonymized usage data from opted-in device panels that vendors use to extrapolate broader install bases.
Tools that turn these signals into numbers generally fall into four camps:
- Market-intelligence SaaS platforms blend rank curves, panel data, and historical calibration into a packaged dashboard estimate. Appalize’s breakdown of estimation methods covers how these vendors combine signal types and why they recommend using the output for relative comparisons rather than as a standalone fact.
- Free public lookups give you rank snapshots, rating counts, and review text without a subscription, which is enough to run a manual rating-velocity calculation.
- Open-source estimators publish the actual formula, so you can see exactly how rating deltas convert into an install estimate. The App-download-estimator project on GitHub uses rating counts and velocity inside a K-factor model that requires a calibration benchmark to be accurate.
- API-based toolchains let engineering teams pull rank and rating data programmatically and feed it into a custom model, often paired with a machine-learning pipeline like the templates in DS-73’s MobileApp-DownloadPrediction repository for teams that want seasonality and channel data baked in.
Most working estimates aren’t built from a single signal. Vendors typically layer a rank-to-download curve as the backbone, then adjust with a rating-velocity multiplier and, where available, a panel-derived correction factor for absolute scale. The rank curve tells you shape; the rating data tells you recent momentum; the panel data (when you have access to it) anchors the whole thing to something closer to a real number.
How Do You Calculate App Download Estimates Yourself?
You don’t need an enterprise subscription to produce a workable estimate. Three reproducible methods cover most use cases, ranked from simplest to most robust.
1. The rating-velocity method
Collect the change in total ratings over a 7 to 30 day window. Multiply that delta by your rating-to-download ratio, a number that varies heavily by category and must be calibrated, not assumed universal.
Monthly downloads ≈ (New ratings in period ÷ days in period) × 30 × rating-to-download ratio
Games and social apps often see far more ratings per install than B2B or utility apps, so a ratio pulled from a gaming benchmark will badly overstate installs for a productivity tool. Calibrate the ratio using your own app’s known download count divided by its own rating delta over the same window, then apply that ratio to competitors in the same category.
2. The rank-to-download method
Gather category rank snapshots over several days. Rank and downloads follow a power-law relationship: the jump from rank 100 to rank 50 represents far fewer additional downloads than the jump from rank 10 to rank 1, a pattern Appalize’s methodology writeup documents clearly. You calibrate the curve by anchoring one or two known points, ideally your own app’s rank and actual download count, then interpolate for competitors at nearby ranks.
3. The hybrid ad-signal approach
Combine rank and rating inputs with ad-intelligence data, active creative count, network presence, and estimated spend, then apply a panel-derived multiplier. This method catches downloads that pure organic signals miss, particularly for apps running heavy paid user acquisition where rank spikes don’t fully reflect long-term organic pull.
| Method | Best for | Typical inputs |
|---|---|---|
| Rating-velocity | Fast trend checks, low-data apps | Rating count, review timestamps |
| Rank-to-download | Category benchmarking | Chart rank history, calibration anchor |
| Hybrid/ad-signal | Paid-heavy or competitive markets | Rank, ratings, ad creative data, panel multiplier |
Pro Tip: Run all three methods on your own app first, where you already know the real download number. Whichever method comes closest is the one you should trust most for competitors in that same category.
How Do You Calibrate Estimates and Set Confidence Bands?
Calibration isn’t a one-time setup. Store algorithms shift, seasonality changes buying behavior, and a single viral spike can throw off a ratio that worked fine last quarter. Re-orient your model every 7 to 30 days rather than trusting a coefficient you set months ago. The IFM rolling-prediction approach on GitHub shows how periodic re-orientation of time-series predictions cuts down cumulative drift, a practical middle ground between daily recalibration and never touching the model at all.
Set your confidence bands honestly rather than presenting a single number. As a working guideline:
- Trend direction (up, flat, down): ±15 to 25% is realistic when your inputs are current.
- Absolute monthly download counts: ±25 to 50%, wider for apps with erratic rank movement.
- Country-level breakdowns: often worse than global figures, since per-country rank and rating data is thinner and noisier.
Reporting error this way isn’t just caution for its own sake. The mean absolute percentage error framework is the standard way forecasters communicate how far off a model tends to run, and applying that same discipline to app estimates keeps you from presenting a guess as a fact.
Three pitfalls show up constantly:
- Applying one rating-to-download ratio across every category. A ratio calibrated on a mobile game will badly misstate a finance app’s installs.
- Ignoring paid spikes. A rank jump driven by a burst ad campaign looks identical to organic growth unless you cross-check ad-intelligence data.
- Small-sample instability. An app with only a few hundred total ratings produces a wildly noisy velocity signal; treat any estimate built on fewer than a few hundred data points as directional only.
A Worked Example: Estimating Monthly Downloads From Public Data
Here’s a full calculation using realistic sample inputs, the kind of numbers you could pull from a public store listing in under five minutes.
Sample inputs:
| Input | Value |
|---|---|
| Category chart rank (Productivity, US) | 42 |
| 30-day rating delta | 180 new ratings |
| Assumed rating-to-download ratio | 1:90 (calibrated from a comparable known app) |
| Country | United States |
Stepwise calculation:
- Convert rating delta to a daily rate. 180 ratings ÷ 30 days = 6 new ratings per day.
- Apply the calibrated ratio. 6 ratings/day × 90 (ratio) = 540 estimated downloads per day.
- Scale to a monthly figure. 540 × 30 = 16,200 estimated monthly downloads.
- Cross-check with the rank curve. A rank-42 productivity app, using a curve calibrated on the same known comparable, lands in a similar 14,000 to 18,000 monthly range, a reasonable convergence.
- Apply the confidence band. Given the ±25 to 50% range typical for absolute estimates, the honest reportable figure is roughly 12,000 to 20,000 downloads for the month, not a bare 16,200.
To validate this against reality, compare it to your own historical download data if you own the app, or to a benchmark CSV like the one the open-source App-download-estimator project recommends building before trusting any K-factor output. If your calibration app’s actual downloads come in outside the band you calculated, adjust the ratio and rerun the curve rather than assuming the formula is broken.
How Should You Use Download Estimates for Growth Decisions?
Estimates earn their keep in three places: benchmarking, user-acquisition planning, and monitoring for outliers. They’re weakest as standalone facts and strongest as comparison tools.
Favor relative comparisons over absolute numbers whenever you can. Estimates are most useful when you compare a coherent cohort, apps in the same category, similar monetization model, similar maturity, rather than stacking a five-year-old game against a two-month-old utility app.
For UA budget planning, convert your estimate into a scenario range rather than a point figure. Take your low, mid, and high download bands, apply your own LTV assumptions to each, and build three budget scenarios instead of committing spend against a single guessed number. A resource like Cult Media’s 90-day B2B marketing roadmap walks through translating growth signals into a phased UA plan, which pairs naturally with scenario-based download forecasting.
Build a simple monitoring rhythm:
- Take monthly rank and rating snapshots for your top three to five competitors.
- Set an alert threshold for sudden rank jumps (10+ positions in a week) or unusual rating velocity spikes.
- When an outlier appears, check for a listing change, a featuring placement, or a paid campaign before assuming organic growth.
Pro Tip: Treat any sudden competitor spike as a signal to investigate, not a number to copy into a report. The cause behind the spike matters more than the spike itself.
Turning These Methods Into an Apptenium Workflow
Running rank-to-download curves and rating-velocity math by hand works, but it gets tedious fast once you’re tracking more than a handful of competitors. Apptenium was built to operationalize exactly this workflow.
The practical sequence looks like this:
- Scan your app’s store listing to capture rank, rating, and metadata snapshots as a baseline.
- Pull in competitor intelligence and keyword tracking data so rank movement and rating velocity are logged automatically instead of manually.
- Connect Firebase and Google Analytics so your own real download and revenue numbers sit next to the modeled estimates, giving you a built-in calibration check.
- Review the AI-generated recommendations, which flag listing changes or keyword gaps likely tied to the download shifts you’re seeing.
| Workflow step | What it replaces |
|---|---|
| Automated rank/rating snapshots | Manual daily rank checks |
| Firebase/GA integration | Spreadsheet-based calibration |
| AI listing recommendations | Guesswork on what to fix next |
This is where the guide’s methods stop being a manual exercise and start feeding actual decisions about listing copy, keyword targets, and where to push UA spend next.
Editorial Take: Why Precision Obsession Misses the Point
Most guides on this topic chase a false promise: a single, precise download number for a competitor’s app. That number doesn’t exist, and chasing it wastes time better spent on calibration.
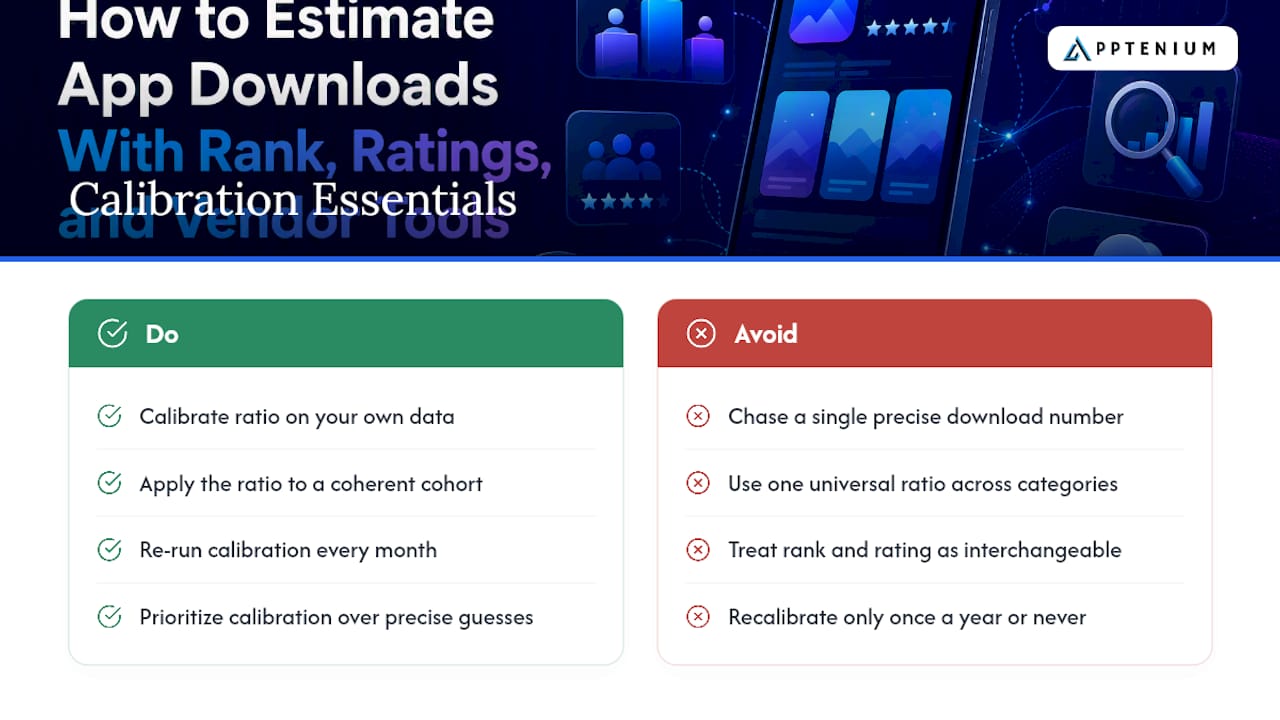
The real skill isn’t finding a magic formula. It’s building a rating-to-download ratio calibrated on your own known data, then applying it consistently to a coherent cohort of competitors.
Conventional advice often treats rank and rating signals as interchangeable across categories. They aren’t. A gaming app’s rating velocity behaves nothing like a B2B utility app’s, and applying one universal ratio is the single most common mistake I see in competitor analysis. If you take one thing from this guide, make it this: calibrate before you trust anything the model tells you, and re-run that calibration every month, not once a year.
— Mike
Try Apptenium for Faster, More Reliable Estimation Inputs
Manually chasing rank snapshots and rating deltas across a spreadsheet works until you’re tracking more than two or three competitors, then it becomes a part-time job. Apptenium gives you a faster path to the same inputs this guide walks through, automated rank and rating tracking, competitor intelligence, and Firebase and Google Analytics integration in one dashboard instead of five browser tabs.
What sets it apart for teams doing this kind of estimation work is the calibration loop: your real download and revenue numbers sit next to the modeled signals, so you can see immediately how far off a rank-based estimate runs for your own app before trusting it for a competitor. Pair that with AI-generated recommendations on keywords and listing changes, and estimation stops being a one-off spreadsheet exercise and becomes part of a running workflow. Explore the ASO feature set or see how it stacks up on the best ASO tool comparison for SMBs and startups to find the plan that fits your tracking needs, then run a free scan to see your own baseline numbers today.
Key Takeaways
Accurate app download estimation depends on combining rank, rating velocity, and vendor signals, then calibrating the model against your own known download data.
| Point | Details |
|---|---|
| Use three methods together | Combine rank-to-download curves, rating-velocity, and hybrid ad-signal approaches for a more robust estimate. |
| Trust bands, not point figures | Expect ±15 to 25% accuracy on trends and ±25 to 50% on absolute download counts. |
| Calibrate on your own app first | Test each method against your known download numbers before applying ratios to competitors. |
| Recalibrate every 7 to 30 days | Rolling recalibration reduces drift as rank algorithms and seasonality shift. |
| Apptenium automates the workflow | Apptenium’s scanning, competitor intelligence, and Firebase/GA integration turn manual calibration into a running dashboard. |
Sources
- App Download and Revenue Estimation: Tools, Methods and Accuracy — Appalize
- Simon-sud/App-download-estimator — GitHub
- Mean absolute percentage error — Wikipedia
FAQ
Is There a Way to Check How Many Downloads an App Has?
Neither Apple nor Google publishes exact download counts publicly, but you can produce a working estimate using rank-to-download curves, rating-velocity math, or a market-intelligence tool like Apptenium, typically accurate to within ±25 to 50% 50% for absolute figures.
How Much Does an App With 10,000 Downloads Make?
Revenue depends entirely on monetization model, ad-supported, subscription, or one-time purchase, so there’s no fixed figure; estimating it requires combining a download estimate with an average revenue-per-user assumption for that app’s category, and the resulting range is typically wider than the download estimate itself.
What Is the Best App for Making Estimates?
There’s no single best tool for every use case. Open-source estimators like the App-download-estimator project suit developers who want to see the formula, while an all-in-one platform like Apptenium suits teams that want rank, rating, and competitor data combined with calibration against their own Firebase and Google Analytics numbers.
What Is the #1 Most Downloaded App?
Top-ranking apps shift by region, platform, and season, and exact figures aren’t publicly disclosed by the stores, so any specific claim about the single most downloaded app worldwide should be treated as a rough estimate rather than a verified count.