For ASO Teams: Connect Firebase Data to Dashboards with Apptenium
For ASO Teams: Connect Firebase Data to Dashboards with Apptenium
Export your Firebase analytics by linking the project to BigQuery, then connecting BigQuery to Looker Studio or your ASO/reporting tool to merge event-level data with keyword and revenue metrics. Two constraints matter before you touch the console: BigQuery will not backfill events from before you linked it, and the first export can take 24 to 48 hours to appear. Start in Firebase console under Project settings, then Integrations, then BigQuery.
TL;DR:
- Linking Firebase to BigQuery does not backfill historical data, so it only captures events from the day you establish the connection forward.
- The initial dataset typically appears within 24 to 48 hours, with daily export tables updating overnight and streaming data available faster but less complete until day’s end.
- Exported tables include event-specific details like event name, timestamp, user ID, and nested parameters, requiring UNNEST in SQL for filtering and analysis.
- Costs are driven by query volume and storage, so filtering by date and selecting only necessary columns helps control expenses.
- Use BigQuery exports to combine Firebase data with keywords, ad spend, and revenue metrics for automation and advanced ASO insights, especially when integrating multiple data sources.
Table of Contents
- How Do You Link Firebase to BigQuery?
- What Firebase Data Can You Actually Export, and What Limits Apply?
- How Do You Query and Route Firebase Data Into ASO Reports?
- What’s the Best Way to Control Costs and Permissions?
- How Apptenium Turns Exported Firebase Data Into ASO Insight
- When Should You Export vs. Just Check the Firebase Console?
- Get Your Firebase Data Working for ASO, Not Just Sitting in BigQuery
- Sources
- FAQ
How Do You Link Firebase to BigQuery?
The path is short, but the choices you make along the way stick with you for the life of the project. Open your Firebase project, go to Project settings, click Integrations, then select BigQuery. From there, you link the project and choose what flows through.
Here’s the setup sequence in order:
- Open the integration panel. In Project settings > Integrations > BigQuery, click “Link.” Firebase shows you which products are eligible for export to BigQuery, including Google Analytics, Crashlytics, Cloud Messaging, and Performance Monitoring.
- Pick your apps and streams. If your Firebase project spans multiple apps (an iOS app and an Android app under one project, for example), you choose which ones export data. You do not have to export everything at once.
- Set the dataset location. BigQuery asks where to store the dataset geographically. Choose carefully. Changing location later means copying the entire dataset to a new one instead of a quick setting flip.
- Confirm and link. Once confirmed, Firebase begins creating your BigQuery dataset, typically named
analytics_<PROJECT_NUMBER>. - Wait for the first tables. Daily export tables usually populate within a day; streaming (intraday) tables can show up faster but carry less complete data until the day closes out.
Two export modes run in parallel once you’re linked. Daily export writes a full table for the previous day’s events, usually within hours after midnight in your project’s time zone. Streaming export, if enabled, pushes intraday data throughout the current day so you’re not stuck waiting until tomorrow to see today’s numbers. Most ASO reporting workflows lean on the daily tables for stability and use streaming only when same-day visibility actually matters, like monitoring a launch or a paid campaign spike.
One detail trips up teams every time: linking BigQuery does not retroactively pull in your historical Analytics data. Whatever happened before you clicked “Link” stays in the Firebase console’s own reports, inaccessible to your BigQuery queries. If you know a BigQuery-based reporting pipeline is in your future, link early, even before you’re ready to build anything on top of it.
What Firebase Data Can You Actually Export, and What Limits Apply?
Once linked, Firebase writes your Analytics events into tables named events_YYYYMMDD, one per day, plus an intraday table (events_intraday_YYYYMMDD) that updates continuously until the day closes. There’s no historical backfill, so the calendar effectively starts the day you link the project.
Each event row carries a predictable set of columns:
event_name, the label for what happened (a session start, a level completed, a purchase)event_timestamp, in microseconds since epochuser_pseudo_id, Firebase’s anonymized user identifierevent_params, a repeated record holding key/value pairs for that specific eventuser_properties, another repeated record for user-level attributes
Because event_params is a repeated (nested) field, you need UNNEST in SQL to pull individual parameter values into flat columns you can filter or group on. Pairing that with _TABLE_SUFFIX lets you scan only the date range you actually need instead of every table since launch.
Quick numbers to keep in mind: the standard export ceiling for Analytics events sits around 1 million events per day on the default tier, and BigQuery’s Sandbox mode lets you experiment with exported data at no cost, within Sandbox’s own storage and query limits, before you commit to a paid project.
How Do You Query and Route Firebase Data Into ASO Reports?
Raw event tables are only useful once you can join them to the other metrics your ASO reporting actually runs on: keyword rankings, ad spend, revenue per install. Getting there means a handful of repeatable query patterns rather than one giant script.
- Start with a subquery that unnests
event_params, filters for the key you want (say,valueon a purchase event), then joins the result back to the base event row. This keeps costs predictable because you’re not unnesting the entire table for every query. - Use
_TABLE_SUFFIX BETWEEN '20260101' AND '20260131'style filters instead of a wildcard scan across your whole event history. - Select only the columns you need. Pulling
SELECT *across nested fields is one of the fastest ways to burn through your monthly bytes-scanned budget. - Build a daily aggregation view (installs, first-opens, revenue events) that your dashboard tool queries instead of hitting raw event tables every refresh.
Once the query layer is solid, connect the resulting BigQuery datasets to Looker Studio using the native BigQuery connector, which lets you build shareable dashboards blending Firebase data with outside sources. That’s also the point where you join event-level Firebase metrics against ASO keyword exports or ad network spend data to calculate cost per install, revenue per install, or which keyword clusters are actually driving retained users, not just downloads.
Pro Tip: Build one clean, pre-aggregated view per metric you report on weekly. Querying raw daily event tables from a live dashboard every time someone opens it is the single fastest way to blow through your BigQuery budget for no real benefit.
What’s the Best Way to Control Costs and Permissions?
Enabling the export requires more than clicking a button. Your account needs project-level IAM permissions, specifically something like firebase.links.update, and in many setups a Google Analytics account role tied to that same project. Once BigQuery holds the data, separate ACLs govern who or what can read the dataset downstream, which matters a lot when a third-party ASO tool needs access.
A short operational checklist keeps this from becoming a mess later:
- Grant least privilege. Give reporting tools and teammates read-only access to the dataset, not editor or owner roles, unless they’re actively managing the pipeline.
- Run dry-run queries before scheduling anything. BigQuery will estimate bytes scanned before you run a query, catching an expensive mistake before it costs you.
- Partition and filter aggressively. Combine date partitioning with
_TABLE_SUFFIXfilters and column selection to keep every scheduled query lean. - Add monitoring and retry logic. Because streaming exports can hit transient latency, production ETL jobs should log failures and retry with exponential backoff rather than silently dropping a day’s data.
- Export only what you need. Skip parameters and user properties you’ll never query. Smaller tables mean cheaper joins and faster dashboard refreshes.
Pro Tip: Link BigQuery the same week you set up a new Firebase project, even if you’re not ready to build reports yet. There’s no cost to linking early, and every week you wait is a week of data you’ll never get back.
How Apptenium Turns Exported Firebase Data Into ASO Insight
Getting the export running is only half the job. The real payoff comes when that event data sits next to your keyword rankings, ad spend, and revenue in one place. Some ASO platforms aggregate Firebase and Google Analytics exports with ad network and ASO data, so downloads, revenue, and keyword performance can appear in a single dashboard instead of multiple browser tabs.
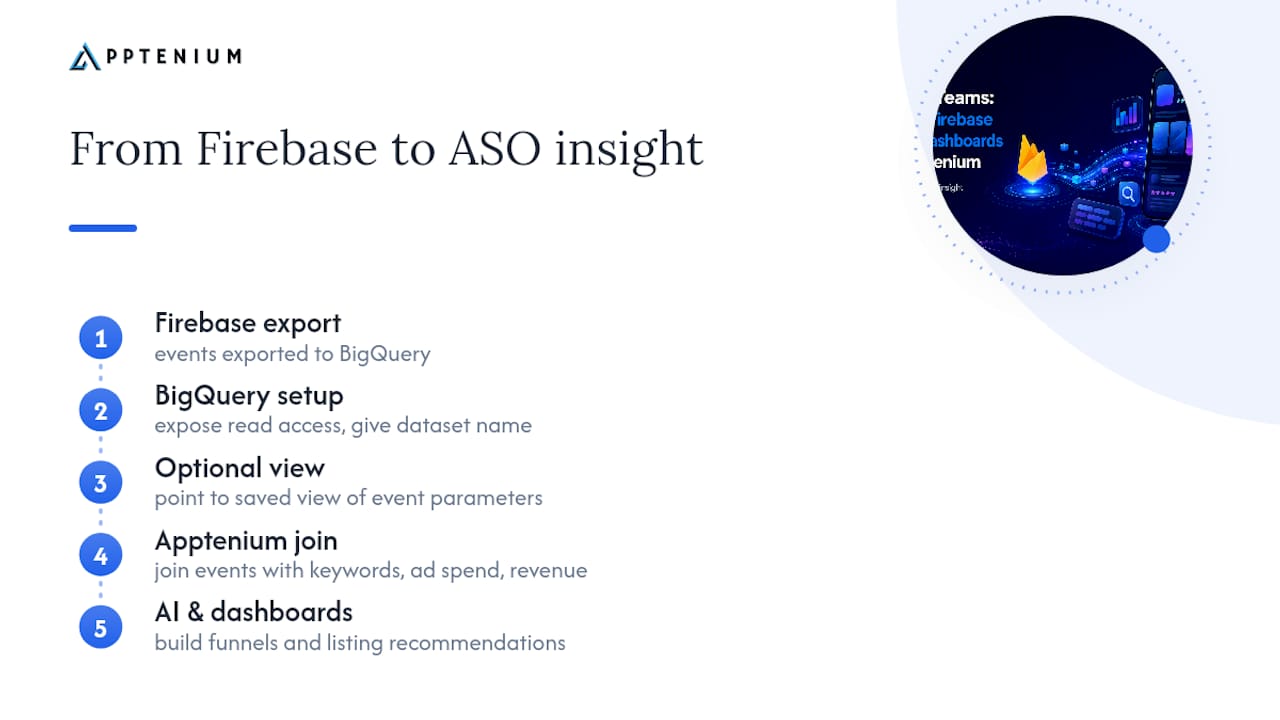
Joining event-level data to keyword tracking can enable AI to build custom funnels and surface listing recommendations based on user activity after install, not just how they found the app. To connect your export, you’ll typically need to expose BigQuery read access, hand over your dataset name, and optionally point to a saved view holding just the event parameters your reporting actually uses. That’s it.
When Should You Export vs. Just Check the Firebase Console?
The rule I’d give any app marketer: export to BigQuery once you need to join Firebase events with anything outside Firebase, or once you’re running the same check often enough to automate it. The console works fine for a one-off “did installs spike yesterday” glance.
Automation trades a small BigQuery bill for control. You decide the schema, the refresh cadence, and exactly which parameters survive into your reports. Console reports decide that for you. Having watched plenty of ASO teams bolt on tools one at a time before wiring them together, the pattern is consistent: the export pays for itself the moment you need a second data source in the same chart.
— Mike
Get Your Firebase Data Working for ASO, Not Just Sitting in BigQuery
There are tools available that serve as shortcuts between raw BigQuery tables and actionable ASO dashboards. Some platforms can pull together sources like Firebase events, ad spend, and keyword rankings automatically and provide AI recommendations covering downloads, revenue, and listing performance in a single interface, sometimes alongside additional features like an app icon generator.
Before connecting, have three things ready: BigQuery read permission on your project, your dataset name (it follows the analytics_PROJECTNUMBER pattern), and, if you’ve built one, a saved view limited to the event parameters you actually report on. That last piece keeps the integration lean from day one.
Check the ASO features built for growing teams to see how the Firebase ingestion fits into the broader platform, or compare options directly on the best ASO tool for SMBs page if you’re still weighing your setup. Once you’re ready, start a trial and connect your Firebase export in the same session.
Sources
Keep a few official pages open while you’re setting this up, since the schema and permission details change more often than most third-party tutorials keep pace with.
- Link BigQuery to Firebase — Firebase Help
- BigQuery and Firebase: Integration and streaming — Firebase blog
For teams building out analytics tracking more broadly, Plexo’s guide on tracking traffic sources offers useful patterns that translate well to analyzing exported event data outside of Firebase’s own tooling.
FAQ
Does Firebase Data Export Cost Money?
BigQuery charges for storage and queries once you’re past its Sandbox limits, but linking Firebase to BigQuery itself carries no separate fee. Costs scale with how much data you scan, which is why filtering by _TABLE_SUFFIX and selecting specific columns matters.
Can You Recover Historical Firebase Data After Linking?
No. BigQuery export starts collecting data from the moment you link the project forward, with no backfill for events that happened earlier. That’s why linking early, even before you need the data, is worth doing.
How Long Until Firebase Data Shows Up in BigQuery?
Daily export tables typically appear within a day of linking, while initial propagation can take up to two days. Intraday streaming tables, when enabled, update throughout the current day.
What’s the Best Way to Connect Firebase Exports to an ASO Tool?
Export to BigQuery first, then either connect the dataset directly to your ASO platform or route it through Looker Studio for a dashboard layer. Apptenium ingests Firebase and Google Analytics exports directly and joins them with keyword and ad network data automatically.
Is There a Daily Limit on Firebase Analytics Events?
Yes, the default export cap sits around 1 million events per day on the standard tier, and BigQuery’s Sandbox mode has its own separate storage and query limits for teams testing before committing to a paid setup.