How to Measure ASO Impact: A Practical Framework

How to Measure ASO Impact: A Practical Framework
To measure ASO impact, set a baseline before you change anything, log every change with its date, and compare the same metrics over a window you chose in advance. Track the chain from visibility to conversion to installs to revenue, split organic from paid, and control for seasonality. Use a randomized product page test whenever you can. Report a range, not a single magic number.
This guide walks through that process step by step: which metrics matter, where the data lives, how to keep paid campaigns and seasons from fooling you, and how to turn the result into a decision your team can act on.
TL;DR
- Measure ASO as a chain: impressions and keyword rank, then store conversion, then installs, then retention and revenue per install.
- Write down the baseline, the change, the date and the comparison window before you ship anything.
- Separate organic search, browse, paid and referrals. Do not credit all organic growth to ASO.
- Prefer the strongest method available: a product page test first, then a market holdout, then a seasonality-aware before-and-after.
- Report ranges and uncertainty, and tie every result to a business outcome such as paid conversion or proceeds per download.
Table of Contents
- What “ASO impact” actually means
- Build the baseline first
- The metrics that show whether ASO is working
- Know your data limits
- Separate organic ASO results from everything else
- Pick the strongest measurement method you can
- A worked example
- Report the result honestly
- Our perspective
- Put the workflow in one place
- A simple monthly measurement routine
- FAQ
- Sources
What “ASO impact” actually means
App Store Optimization is the ongoing work of improving your metadata and visual assets so your app ranks for relevant searches and converts more of the people who see it into installs. That gives you two separate questions to answer after any change:
- Did more people see the app? This is a visibility question, driven mostly by keywords, category and rankings.
- Did more of those people install? This is a conversion question, driven by your icon, screenshots, video, title, subtitle and description.
Mixing the two is the most common reason teams misread results. A new screenshot set cannot raise your keyword rankings directly, and a new keyword set cannot fix a weak product page. When you know which lever you pulled, you know which metric should move.
There is a third layer that separates a reporting exercise from a business case: what those installs are worth. An install from a better-matched keyword can bring users who subscribe, and an install from a vague one can bring users who leave on day one. Impact is only real once it shows up in retention, paid conversion or revenue.
Build the baseline first
You cannot measure a change without a clean “before.” Spend a week or two on setup before you touch the listing.
Capture the starting numbers
For each country and platform you care about, record at least the following for the last 8 to 12 weeks:
- Impressions and product page views
- Downloads, split by source (search, browse, referral, paid)
- Store conversion rate
- Rank for your 20 to 50 most important keywords
- Day 1, Day 7 and Day 30 retention
- Revenue, subscriptions or in-app purchase conversion per download
Also capture a year-ago view of the same period if you have it. Many apps have strong seasonal swings, and last year’s curve is the cheapest control you will ever get.
Keep a change log
A change log is the unglamorous habit that makes everything else trustworthy. For every ASO change, record:
- What changed (title, subtitle, keyword field, screenshot 3, icon, short description)
- Which store, country and locale
- Submission date, approval date and the date it actually went live
- A copy of the previous version so you can roll back
- Anything else happening at the same time: app releases, price changes, promotions, featuring, PR, paid spend changes, big competitor moves
Record submission, approval and visibility as separate events. Metadata can take time to be indexed, and the day you pressed submit is rarely the day the store started acting on it.
Choose the comparison window in advance
Decide how long you will wait and which period you will compare against before you see any results. If you pick the window afterward, you will be tempted to choose the one that flatters the change. A common pattern is a weekly check for operations and a monthly review for strategy. Space your interventions out: let a metadata change settle before you ship a creative update, or you will not know which one did the work.
The metrics that show whether ASO is working
Organize your dashboard as a chain. Each link tells you something different.
| Stage | Metric | What it tells you |
|---|---|---|
| Visibility | Impressions, keyword rank, number of ranking keywords | Whether the store shows you to more people |
| Interest | Product page views, tap-through | Whether your icon, title and first screenshot earn the click |
| Conversion | Store conversion rate | Whether the product page persuades |
| Volume | Installs by source | How many extra users the change produced |
| Quality | Retention, activation | Whether the new users are the right users |
| Value | Download-to-paid conversion, proceeds per download, revenue | Whether ASO pays for itself |
How the stores define the key numbers
Definitions matter because the same label can mean different things in different tools. Apple’s App Store Connect Analytics defines conversion rate as total downloads divided by unique impressions, where a unique impression is a person who views your app icon on the App Store in a given day. Its example: 100 unique impressions and 50 downloads is a 50% conversion rate. Retention is defined on the same page as the share of devices that opened the app in the days after download, relative to devices that downloaded it on the same day.
On the revenue side, Apple’s peer group benchmarks include Day 35 Download to Paid Conversion, the percentage of downloads followed by an in-app purchase within 35 days, and Day 35 Proceeds per Download, the average proceeds generated within 35 days of a download. These two are especially useful for ASO because they connect a listing change to money.

Google Play changed its listing metrics
If you track Android, check the definitions you are using. According to Play Console Help, from June 2026 the primary store listing metrics are based on unique clicks, counting unique users who click Install, Open or Pre-register on your listing, and they replace the legacy conversion rate metric with click-through rate. That means a drop in reported store listing visits around the transition is a measurement change, not necessarily a visibility change. Annotate the switch in your dashboard so nobody reads it as an ASO result.
Apple expanded its analytics in 2026
On March 25, 2026, Apple announced the biggest App Store Connect Analytics update since launch: more than 100 new metrics, new cohort capabilities, two new peer group benchmarks (download-to-paid conversion and proceeds per download), two new subscription reports and up to seven filters applied at once. For ASO teams, this makes it far easier to follow a cohort of users from a specific listing change all the way to a subscription.
Know your data limits
Every source has blind spots, and good measurement names them.
- Apple’s usage data includes only users who agreed to share diagnostics and usage information, so some figures are a sample, not a full count.
- Some sources, such as app referrers, web referrers and campaign links, need a minimum amount of data before they appear.
- Peer group benchmark values are created with differential privacy, so treat them as directional context rather than an exact league table.
A practical setup uses three kinds of data joined by date, country and source: store console data for impressions, page views and conversion; a rank tracker for keyword positions; and product analytics for activation, retention and revenue. Write down each definition once so that “conversion” means the same thing in every report. If you are choosing the wider stack for that workflow, a roundup of AI tools for marketing teams can help you compare options for the reporting layer.
Separate organic ASO results from everything else
This is where most measurement goes wrong. “Organic” in an attribution tool usually just means “not attributed to a paid click.” It includes store search, browse, referrals, word of mouth and users who were influenced by a campaign but never clicked an ad. If you launch a big paid push and organic installs rise, ASO did not necessarily earn that.
Paid campaigns
On iOS, compare App Store Connect performance with your Apple Ads data and your mobile measurement partner’s reports to estimate how much of App Store search and browse traffic was paid. On Google Play, use the acquisition source reporting to split Search, Explore, Ads and Referrals, and accept that some attribution ambiguity remains. Log every significant paid change, and when possible hold paid spend steady during an ASO test window. A guide to tracking campaign performance can help you set up consistent campaign records alongside your ASO log.
Seasonality
Seasonality is the quiet trap. Imagine a fitness app that ships new metadata on December 1 and compares January with November. The January surge in fitness interest would be booked as an ASO win. Defend against it by comparing against the same period a year earlier, or against a market where you did not make the change.
Source and market segmentation
Break results down by country, platform, source type and app version. Track brand and generic search traffic separately: a rise in branded searches usually reflects awareness, not keyword optimization. Then match the change to the place it should show up:
- Metadata changes should appear in search traffic, in the markets and locales you changed.
- Creative changes (icon, screenshots, video) should appear in conversion rate.
- Category changes should appear in browse and chart traffic.
- Featuring looks like a dated browse spike that decays.
- Paid campaigns show up in their own source, with possible organic movement beside them.
If the movement appears somewhere the change could not have reached, suspect something else.
Pick the strongest measurement method you can
Not every change can be tested the same way. Rank your methods from strongest to weakest and use the best one available.
- Randomized product page test. Show different versions of the page to randomly split traffic at the same time. This controls for seasonality and paid noise because both versions face the same conditions.
- Localization or country holdout. Change the listing in some markets and keep similar markets unchanged, then compare.
- Seasonality-controlled before-and-after. Compare pre and post periods and adjust against the same period last year or a control market.
- Annotated trend. The weakest option: a time series with the change marked. Useful for context, not for proof.
Apple’s Product Page Optimization documentation says Analytics provides built-in statistical analysis using Bayesian techniques, assigns a confidence level to each result, and labels a treatment as Performing Better or Performing Worse once it reaches 90% confidence against the baseline. Use that label as your decision threshold instead of eyeballing a gap.
Run tests long enough to cover full weekly cycles, and longer for apps with low traffic. Do not stop the moment a result looks good, and do not generalize a winning test in one market to a very different one without caution.
Do not borrow a benchmark
It is tempting to promise “a 20% lift” because you saw it in a case study. Do not. Industry attempts to publish a credible benchmark for organic uplift are hampered by huge variance between apps. Your own baseline is the only benchmark that matters, so set a target before the change (for example, move average rank for a keyword cluster from 15 to 12 within six weeks) and judge yourself against it.
A worked example
Suppose you run a budgeting app and want to know whether a new subtitle and screenshot set helped.
Setup. For ten weeks, you record 40 tracked keywords, weekly impressions, conversion rate and Day 35 download-to-paid conversion in the US and Canada. You log that paid spend is flat and no app update is planned.
Change 1 (week 11). You update the subtitle and keyword field in the US only. You keep Canada unchanged as a control. You expect search impressions and keyword rank to move in the US, and conversion to stay roughly flat.
Check (weeks 12 to 15). US search impressions rise while Canada stays level, and your tracked cluster rank improves. Conversion is unchanged, as expected. You report the US change in impressions relative to Canada, as a range.
Change 2 (week 16). Now that the metadata has settled, you run a product page test on the first three screenshots. When the platform reports the treatment performing better at 90% confidence, you roll it out.
Business outcome. You compare Day 35 download-to-paid conversion for the cohort that arrived after the keyword change. If it held or improved, the extra volume was valuable. If it fell, you learn that the new keywords attract the wrong audience, which is also a useful result.
Notice the structure: one change at a time, an expected metric per change, a control, and a business metric at the end.

Report the result honestly
A useful ASO readout keeps the original question visible. Include:
- The question and the decision it informs
- The control and the treatment, and the population tested
- The planned metric and decision rule, set in advance
- Actual dates, interruptions and any deviations
- Counts and rates, the effect size and the uncertainty
- A decision: adopt, reject, investigate or repeat, with a reason
Report ranges instead of false precision. “Search impressions rose roughly 8% to 14% against the control market” is more credible, and more useful to a finance lead, than “ASO delivered 11.3%.” Walk the result down the chain, from visibility to conversion to installs, then to value per install and finally net revenue and payback. Only the last three links belong in an ROI calculation.
Our perspective
Most teams we talk to do not have an ASO measurement problem. They have a fragmentation problem. Rank data sits in one tool, store conversion in a console, revenue in an analytics dashboard and ad performance somewhere else. By the time someone stitches these together, the change that mattered is three weeks old and nobody remembers what shipped.
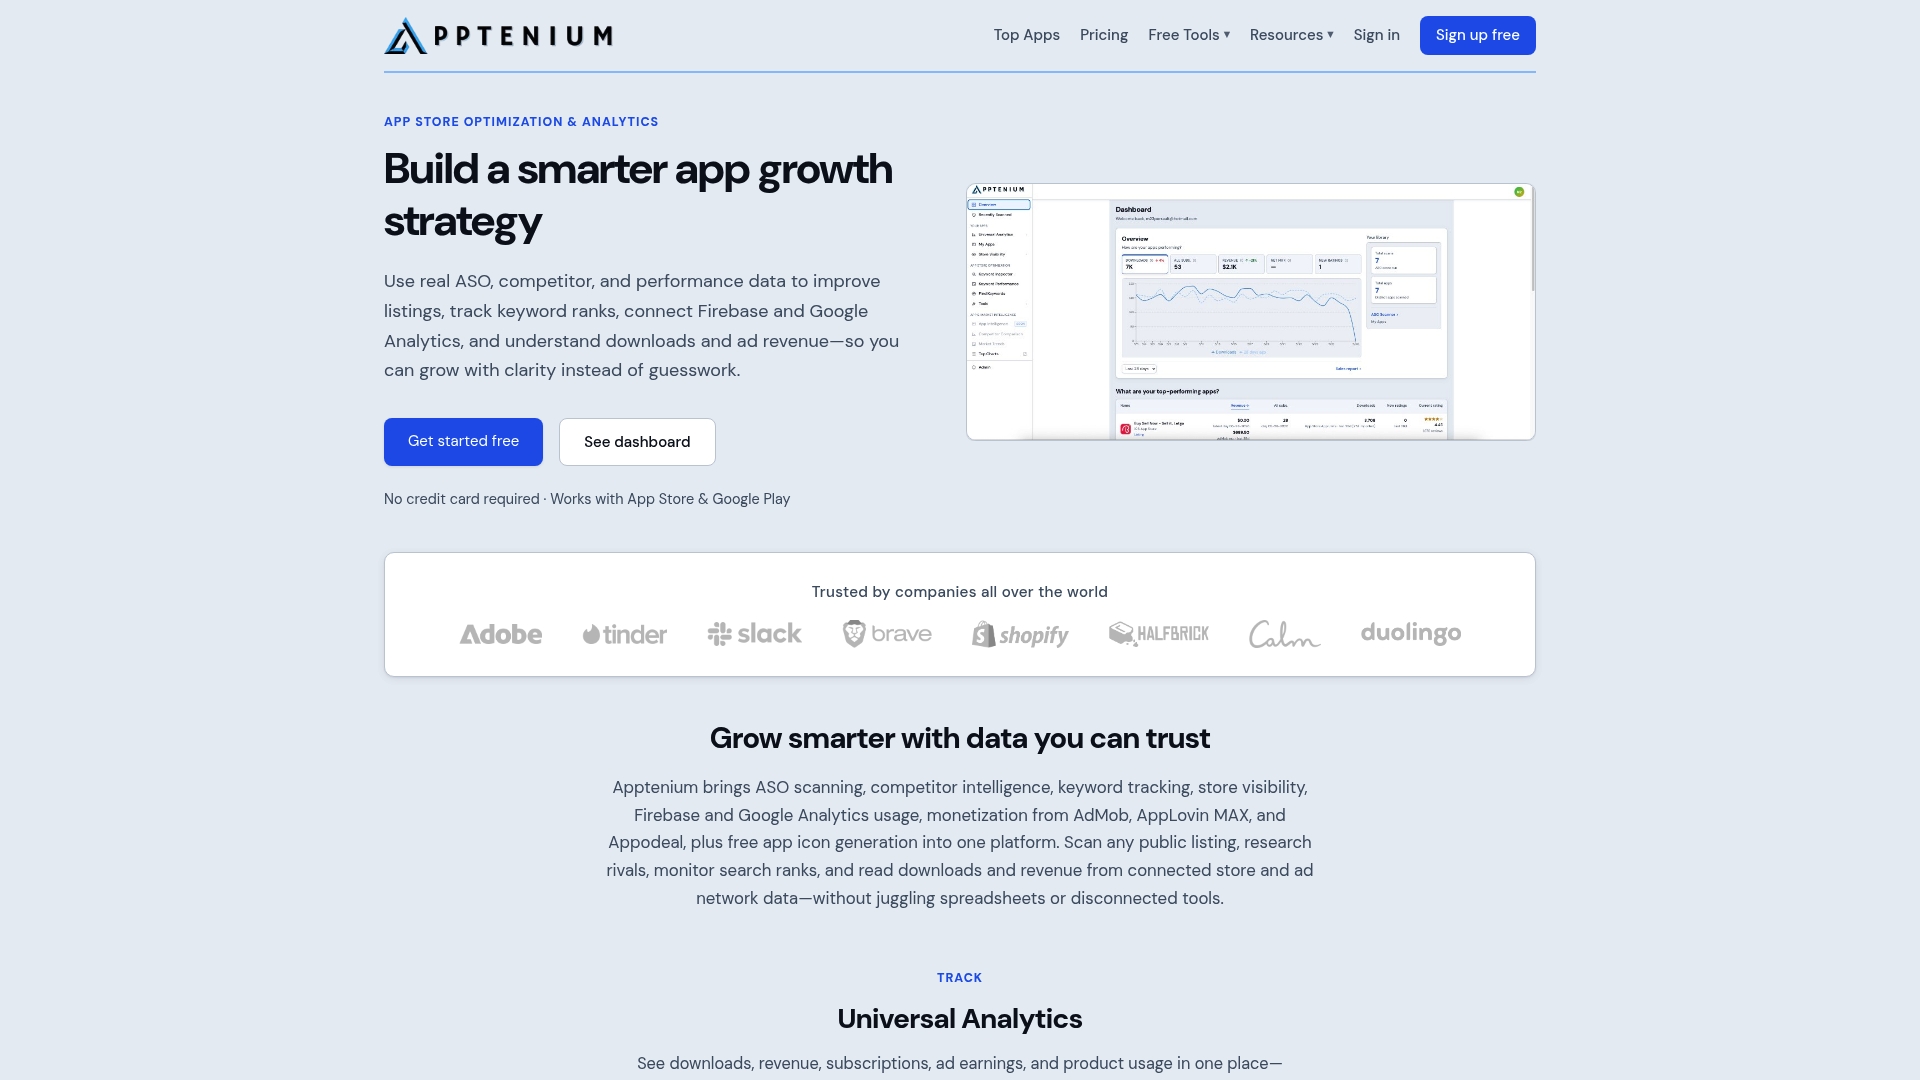
That is why we built Apptenium as one place for the whole loop: scan your listing, track keywords and competitors, and see downloads, revenue, subscriptions and ad monetization next to your optimization work, with Firebase and Google Analytics data connected. Our AI recommendations are designed to give you copy-ready fixes from every scan, so each change you log is specific and testable.
Our advice is simple. Make one change, log it, pick the metric it should move, and look at the business outcome last. When your listing work and your performance data live together, measuring impact stops being a quarterly project and becomes a weekly habit that compounds over time.
Mike
Put the workflow in one place
If you want to run this framework without juggling spreadsheets, start with Apptenium. The free ASO tools let you scan your listing metadata and check word frequency, and the free plan includes a limited number of scans each month, which is enough to capture a baseline. The ASO tools cover keyword tracking and search rank analysis, market and competitor intelligence shows how rivals move around your changes, and app analytics brings downloads, revenue and ad data into the same view.
When you are ready for unlimited scans and premium features, the Pro plan is $9.99 per month. See plans and pricing for what each tier includes.
A simple monthly measurement routine
Once the baseline exists, the routine is short:
- Weekly: check impressions, rank movement for your tracked keywords, conversion and installs by source. Flag anomalies and add annotations for releases, campaigns and external events.
- Monthly: review each logged change against its expected metric, compare with the control or last year, and make an adopt, reject, investigate or repeat decision.
- Quarterly: archive a snapshot of your listing and dashboards so you can make before-and-after comparisons later, and review whether your tracked keywords still match your strategy.
Keep the log, the definitions and the snapshots in one shared place. The habit matters more than the tool.
FAQ
How long should I wait before judging an ASO change?
Wait long enough to cover several full weekly cycles, and longer for low-traffic apps. Metadata changes often need time to be indexed and settle, so avoid stacking a creative change on top of them. Choose your window before the change goes live, not after you see the numbers.
Which ASO metric matters most?
There is no single one, because visibility and conversion answer different questions. Start with impressions and keyword rank for visibility, store conversion for the page, and download-to-paid conversion or proceeds per download for value. The metric that matters most is the one the specific change was meant to move.
How do I know if ASO or paid ads drove my organic installs?
Segment installs by source and compare against ad data and your attribution reports. Hold paid spend steady during tests where you can, and use a control market or the same period last year. Some ambiguity remains, so report a range rather than crediting all organic growth to ASO.
Can I measure ASO impact for free?
Yes. App Store Connect and Google Play Console both provide impression, page view and conversion data at no cost, and Apple’s product page tests are built into its analytics. Add a change log and a free listing scan to set your baseline, then upgrade to a paid tool when you need unified tracking across stores.
Sources
- App Analytics, App Store Connect (Apple Developer)
- Peer group benchmarks, App Store Connect (Apple Developer)
- Product Page Optimization, App Store Connect (Apple Developer)
- App Store Connect Analytics update, Apple Developer News
- Understand and grow your app’s user base, Play Console Help
- Best AI tools for marketing teams
- How to track campaign performance