How to Unify App Analytics Into One Reliable View

How to Unify App Analytics Into One Reliable View
To unify app analytics, bring your store data (impressions, page views, installs), your in-app behavior data, and your revenue and ad data into one place, defined by one set of metric names and one set of IDs. Do that and you can finally see how a keyword change in your listing turns into installs, retention and revenue. We built Apptenium for exactly this job, and this guide walks you through what to combine, how to normalize it, and how to read the result.
TL;DR
- Unifying app analytics means joining three layers: store visibility and conversion, in-app engagement, and monetization (subscriptions, in-app purchases, ad revenue).
- Start with a metric dictionary and a single app and campaign naming scheme. Tools come second.
- Track a short funnel: impressions, product page views, store conversion, installs, retention, revenue per install.
- Unified data is what lets you tie listing and keyword changes to organic installs and revenue.
- Agencies and portfolio owners need the same schema across every app, so reports compare cleanly.
Table of Contents
- What it means to unify app analytics
- The three data layers worth bringing together
- How to connect and normalize the data
- Metrics a unified dashboard should track
- Using unified analytics to grow visibility and revenue
- Data quality, attribution and privacy
- Managing unified analytics across many apps
- Try it on your own app
- FAQ
- Sources
What it means to unify app analytics
Most teams start with the same pattern. App Store Connect lives in one tab, Google Play Console in another, Firebase or Google Analytics in a third, and each ad network has its own dashboard. Every one of them is accurate on its own terms. The trouble is that they use different definitions, different time zones, different attribution windows and different names for the same thing.
Unifying means turning those separate views into a single reporting layer where:
- Definitions match. “Install,” “active user” and “revenue” mean one thing in every chart.
- Identifiers match. An app, a country, a campaign and a keyword carry the same label wherever they appear.
- Time lines up. Daily data from every source is aligned to the same reporting day and currency.
- Questions cross sources. You can ask “did the new subtitle lift organic installs, and did those users subscribe?” without exporting three spreadsheets.
The payoff is practical. You spend less time reconciling numbers, and more time deciding what to change. One published case study from a mobile engineering firm describes a client that saved an estimated 40% of the time previously spent on manual data consolidation after moving to a unified analytics strategy. Treat that as one company’s experience rather than a benchmark, but the direction matches what most teams report: the manual stitching is the first thing to go.
The three data layers worth bringing together
You do not need every data source on day one. You need the layers that explain the path from a search to a paying user.

1. Store visibility and conversion
This is the top of your funnel, and the layer most teams under-measure. On iOS, App Store Connect defines metrics such as impressions, product page views and conversion across the journey from discovery to long-term engagement. On Android, the Play Console acquisition reports separate store listing visitors by source, including Google Play search (organic), tracked UTM channels and third-party referrers.
Add the data you generate yourself here: keyword rankings, listing metadata, and what your competitors rank for. This is where ASO work lives, and it is the layer that most directly drives organic installs.
2. In-app behavior
Firebase and Google Analytics record what users do after install: onboarding completion, feature use, sessions, retention. Firebase lets you export app event data to BigQuery, which is useful when you need row-level data for deeper analysis.
3. Monetization
Subscriptions, in-app purchases and ad revenue complete the picture. If you run ads inside your app, ad network revenue is often reported separately from purchase revenue. Without both, you can’t compare a user who subscribes with one who generates value through ad impressions, and you’ll misjudge which acquisition source is worth growing.
How to connect and normalize the data
The technical pattern is the same whether you build it or buy it. Data integration guides describe it as ingestion through managed connectors or API pipelines, followed by transformation: standardizing schemas, deduplicating records and resolving identities before the data lands in one consolidated place.
In app analytics terms, that becomes five steps.
- Write a metric dictionary. Define each metric once: what counts as an install, which revenue is net of store fees, which window defines “retained.” Put it where everybody can read it.
- Standardize naming. Use one app identifier across iOS and Android, ISO country codes, and a consistent campaign naming convention. Messy campaign names are the most common reason cross-source reports fall apart.
- Align time and currency. Pick one reporting time zone and one reporting currency, and convert at a consistent rate.
- Connect sources. Pull in store data, Firebase or Google Analytics events, and ad network revenue through connectors or APIs.
- Validate against the originals. Compare totals in your unified view to the source dashboards each week at first. Small gaps are normal because platforms process data differently; large or growing gaps signal a mapping error.
Apptenium handles the connector step for the data an ASO team needs most. Our app analytics view brings downloads, revenue, subscriptions and ad monetization together, and it integrates with Firebase and Google Analytics and with ad networks, so you are not maintaining pipelines by hand.
Metrics a unified dashboard should track
A dashboard that tries to show everything shows nothing. Start with a short funnel and add depth only when a question demands it.
| Stage | Metric | Question it answers |
|---|---|---|
| Visibility | Keyword rankings, impressions | Are people finding the listing? |
| Interest | Product page views | Does your listing earn the tap? |
| Conversion | Store conversion rate | Does the page persuade? |
| Acquisition | Installs by source (organic, paid, referral) | Where do users really come from? |
| Engagement | Day 1 and day 7 retention, key feature use | Do installs turn into users? |
| Revenue | Revenue per install, subscription starts, ad revenue per user | Which sources pay back? |
Two habits make this table useful. First, always segment by country and platform: an average across the world hides the market where your listing actually works. Second, read the funnel left to right. If impressions rise but page views don’t, the icon or title is the problem. If page views rise but conversion falls, the screenshots or description are failing the visitors you attract.
Revisit the funnel monthly, and add a metric only when a decision depends on it.
Using unified analytics to grow visibility and revenue
Unification pays off when it changes what you do on Monday morning. Here are four workflows that depend on having the layers joined.
Tie listing changes to outcomes
Change a title, subtitle or short description, and note the date. With unified data, you can see the effect on keyword rankings, page views, conversion and then on downstream retention and revenue. Google notes that the Play Console acquisition reports let you evaluate how store listing changes affected click-through rate, and the same logic applies on iOS. In a unified view you also see whether the users gained were worth having.

Find the keywords that bring valuable users
Not every keyword is equal. A term that brings many installs and little retention is costing you. Matching keyword tracking to revenue and retention shows which clusters deserve more room in your metadata. Our ASO tools scan your listing metadata and give AI-powered suggestions, with copy-ready fixes you can apply directly.
Watch the market, not just your app
A rank drop is ambiguous without context. Did you slip, or did a competitor ship an update and a new keyword push? Competitor intelligence in the same place as your own numbers answers that. See how we approach it in competitor intelligence.
Balance monetization against growth
If you earn from both subscriptions and ads, a unified revenue view shows where each user segment sits. You can then decide, for example, whether a source that brings ad-heavy users is worth scaling compared to one that brings subscribers.
Data quality, attribution and privacy
Unified does not automatically mean correct. Plan for these issues from the start.
- Different definitions across stores. Apple and Google count and group things differently, so the same-looking metric may not be directly comparable. Keep platform columns separate before you total them.
- Attribution gaps. Organic installs are partly inferred: they are what is left after attributed sources are subtracted. Treat organic as a trend line and avoid reading single-day changes as proof.
- Duplicate users. The same person may appear across devices or sources. Deduplicating and resolving identities is part of the standard integration process, but you should only do it with the identifiers you are permitted to use.
- Privacy and platform rules. Review each platform’s developer policies and your own privacy disclosures before you combine user-level data. Aggregated store and ad data is usually the safer base for marketing decisions, and your legal counsel should confirm what applies in the regions where you operate.
- Late and revised data. Stores and ad networks revise recent days. Hold your weekly review a few days behind real time before you declare a result.
Managing unified analytics across many apps
Agencies and portfolio owners face the same problem multiplied. Ten apps with ten naming schemes produce ten incompatible reports.
- Use one schema for every app. The same metric dictionary, the same naming rules, the same dashboard layout.
- Group by portfolio, then drill down. Start with the total, then see which app, country or source is moving the number.
- Build reports around client decisions. A client who has to choose between raising a budget and rewriting a listing needs a report that answers that choice. A guide on streamlining agency reporting makes the case for mapping decisions before choosing the numbers.
- Standardize review cadence. A weekly health check and a monthly strategy review keep every app on the same rhythm.
Our perspective
We see the same thing again and again: teams do not lack data, they lack one place where the data agrees with itself. A listing change, a keyword shift and a revenue dip all show up somewhere, but in different tools and on different days, so nobody connects them.
That is why we built Apptenium as one platform. ASO scanning, keyword tracking, competitor intelligence and app performance reporting sit together, with data from Firebase, Google Analytics and ad networks beside them. We think that listing work should be judged by what it does for downloads and revenue, not by rankings alone.
We also believe a scan should end in action. Each scan is designed to produce practical, copy-ready fixes, so you can move from diagnosis to an updated listing in one sitting.
Mike
Try it on your own app
If you want to see unified ASO and performance data without stitching tools together, start with Apptenium. The Free plan includes a limited number of scans each month, which is enough to scan a listing and see what the recommendations look like. The Pro plan is $9.99 per month and adds unlimited scans and premium features. See both on our pricing page.
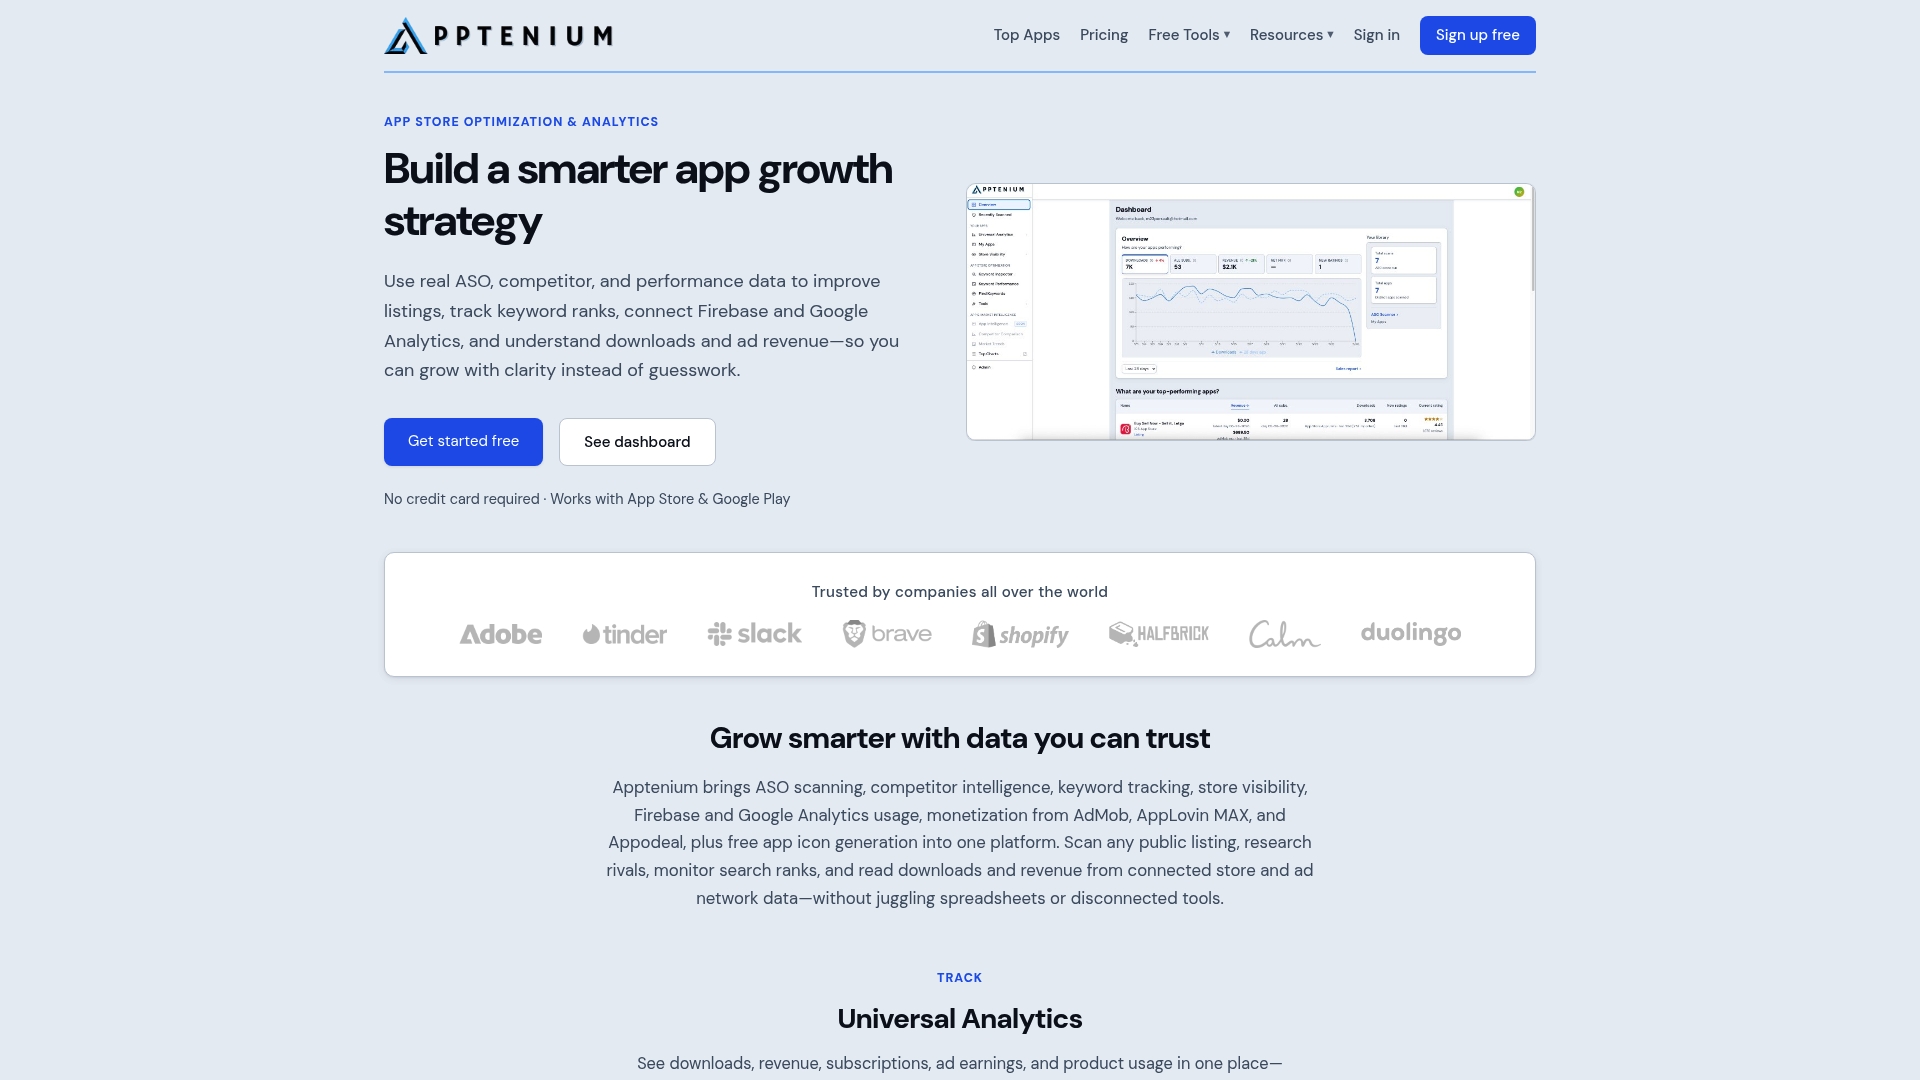
You can also try the free ASO tools, including the scanner, word frequency tool and the app icon generator.
FAQ
What does it mean to unify app analytics?
It means combining store, in-app and revenue data into one reporting layer with shared metric definitions and identifiers. You can then follow a user from a search result through install, engagement and payment. The goal is a single version of the truth for decisions.
Which data sources should I connect first?
Start with your app store data, your Firebase or Google Analytics events and your revenue sources, including ad networks if you monetize with ads. Those three cover discovery, behavior and money. Add attribution or additional ad data once the basics reconcile.
Do I need a data warehouse to unify app analytics?
Not necessarily. A warehouse gives you flexibility and row-level analysis, and Firebase supports BigQuery export. Many teams, though, get what they need from a platform that already connects the sources and reports the key metrics in one dashboard.
How often should I review unified analytics?
Check a short health view weekly and run a deeper review monthly. Wait a few days before judging a listing change, since recent data is often revised and organic installs are noisy day to day.
Sources
- Metric definitions, App Store Connect Analytics (Apple)
- Measure your app’s acquisition and retention (Play Console Help)
- Understand and grow your app’s user base (Play Console Help)
- Export Firebase data into BigQuery (Firebase Documentation)
- What is Data Integration? (Databricks)
- Mobile App Analytics case study (QBurst)