PPO App Store: 10 Practical Tests for App Developers
Product Page Optimization (PPO) is Apple’s built-in A/B testing tool that lets you run up to three alternate product-page treatments against your live App Store listing, testing your app icon, screenshots, or preview video, then promote the winner to every user. Your next step is straightforward: sign in to App Store Connect, navigate to Features → Product Page Optimization, and create a new test. Results surface in App Analytics once at least five first-time downloads are attributed to the test.
PPO runs on real organic App Store traffic, shown to users on iOS 15 or iPadOS 15 and later. It costs nothing to run. For most indie developers, it’s the highest-ROI conversion experiment available because every lift it produces applies to your entire organic audience, compounding over time.
Key facts before you start:
PPO tests one asset category per test: icon, screenshots, or preview video.
Treatments are shown to randomly selected users in search results and the Today, Games, and Apps tabs.
Results are measured in App Analytics with unique impressions, conversion rate, estimated lift, and confidence level.
Tests run up to 90 days or until you stop them manually.
Key Takeaways
PPO is Apple’s free A/B testing tool for product page assets, and running it as a continuous program rather than a one-off experiment is what produces lasting conversion gains.
PointDetailsStart with icon testsIcons affect search impressions and browse placements, so a lift there compounds across your entire organic funnel.Wait for 90%+ confidenceApp Analytics uses Bayesian reasoning; act only when a treatment is labeled “Performing Better” at 90% confidence.Isolate one change per treatmentChanging multiple assets in one treatment makes it impossible to identify which change drove the result.Plan duration by traffic volumeLow-traffic apps need 30–60 days; moderate-traffic apps can reach signal in about one to two weeks with a 50/50 split.Use Apptenium to accelerate cyclesApptenium’s icon generator, ASO scan, and analytics integrations reduce the time from hypothesis to promoted winner.
Table of Contents
How PPO assigns traffic and what constraints you need to plan around
Best practices for designing PPO tests that produce reliable results
Apptenium makes PPO faster from hypothesis to promoted winner
What can you actually test with PPO in the App Store?
PPO supports three asset categories: your app icon, screenshots (per device type), and app preview videos. Each test covers one category. You cannot test your app title, subtitle, keywords, promotional text, or in-app purchase metadata through PPO.
A few boundaries matter here. Custom Product Pages (CPPs) are separate from PPO entirely. CPPs are targeted landing pages for specific audiences or campaigns; PPO is an experiment that ends with one winner promoted to everyone. You also cannot run PPO tests for watchOS or iMessage extensions.
Localization is supported. You can upload localized screenshot and video variants for different storefronts, so a single test can cover multiple languages simultaneously. Icon tests work differently: every alternate icon you want to test must be included in your app binary and declared in your app’s Info.plist before you submit the build for review.
Pro Tip: Start with icon tests. The icon appears in search results before a user ever taps into your product page, so a lift in icon click-through compounds across every search and browse placement, not just direct page visits.
How PPO assigns traffic and what constraints you need to plan around
PPO uses random assignment across organic App Store impressions. Paid Apple Search Ads traffic is excluded, so your results reflect organic user behavior only. That’s a meaningful distinction: if a large share of your installs come from paid campaigns, your test will take longer to reach significance because it draws only from the organic pool.
You can run only one PPO test at a time per app. Once a test starts, you cannot change its treatments, traffic allocation, or asset category. Plan your test fully before you hit start — there is no mid-test editing.
Traffic allocation is flexible. You assign a percentage of impressions to each treatment and the remainder stays on your original page. A 50/50 split between one treatment and the original reaches significance fastest. Adding a second or third treatment dilutes traffic per variant and extends the time to confidence.
Your app must be in “Ready for Sale” status to run a test, and any new metadata in a treatment must pass App Review before the test goes live. The 90-day maximum runtime is a hard ceiling.
One more constraint worth noting: avoid releasing a new app version while a test is running. A version update resets the product page and can invalidate your test data.
How to set up a PPO test in App Store Connect, step by step
Follow this sequence inside App Store Connect. The Tech Talk walkthrough video covers the same flow visually if you want a live demo alongside these steps.
Sign in at appstoreconnect.apple.com and select your app.
Go to Features → Product Page Optimization → + New Test.
Name your test and select the asset category you want to test (icon, screenshots, or preview video).
Add up to three treatments. For each treatment, upload your alternate assets or, for icon tests, confirm the variants are already in your binary.
Set traffic allocation. Assign a percentage to each treatment; the remainder goes to your original. Even splits produce results fastest.
For screenshot or video treatments, submit for App Review. Icon tests that use binary-included variants may not require a separate review cycle, but confirm this in App Store Connect before proceeding.
Once treatments are approved, start the test. It becomes active immediately and begins collecting impressions.
Monitor progress in App Analytics under Acquisition → Product Page Optimization. Check impressions, conversion rate, estimated lift, and confidence label daily or every few days.
When a treatment reaches 90%+ confidence and sufficient impressions, click Apply Treatment to promote it as your new default product page.
Stop the test manually if you need to release a new app version or if the test reaches the 90-day limit without a clear winner.
Teams that document this before launch make far better decisions when they’re reading results under pressure.
How to read your PPO results in App Analytics
App Analytics reports four key metrics for each treatment: unique impressions, conversion rate (first-time installs divided by unique impressions), estimated relative improvement over the original, and a confidence level.
The confidence labels Apple uses are: Collecting Data, Performing Better, Performing Worse, and Likely Inconclusive. These are produced using Bayesian reasoning. Larger lifts register significance faster than smaller ones because the signal-to-noise ratio is higher.
Dashboard FieldWhat It MeansDecision SignalUnique ImpressionsUsers who saw this treatmentVolume check — low numbers mean waitConversion RateFirst-time installs / unique impressionsCore performance metricImprovementEstimated relative lift vs. originalPositive = treatment beating controlConfidenceBayesian probability the result is realAct at 90%+; ignore results below 70%
Wait for 90%+ confidence before promoting a winner. Practitioner guidance also suggests aiming for at least 5,000 unique impressions per variant before drawing conclusions — a low-impression result at high confidence can still be fragile.
Avoid the most common mistake in PPO interpretation: checking results daily and stopping the moment a treatment looks good. Early data is noisy. Give the test time to accumulate volume, and let the confidence label do its job.
Best practices for designing PPO tests that produce reliable results
Good test design is what separates a learning program from a lucky guess. A few principles apply consistently across apps of every size.
Test order that works. Start with your icon, then move to your first one or two screenshots, then preview video. The icon has the widest reach because it appears in search results before users ever visit your page. Screenshots drive conversion once users arrive. Video is worth testing, but it’s the most expensive asset to produce and typically the last lever to pull.
Isolate one major change per treatment. Changing multiple asset types inside a single treatment makes it impossible to know which change caused the lift. If you swap both the icon and the first screenshot in Treatment A, a positive result tells you nothing actionable.
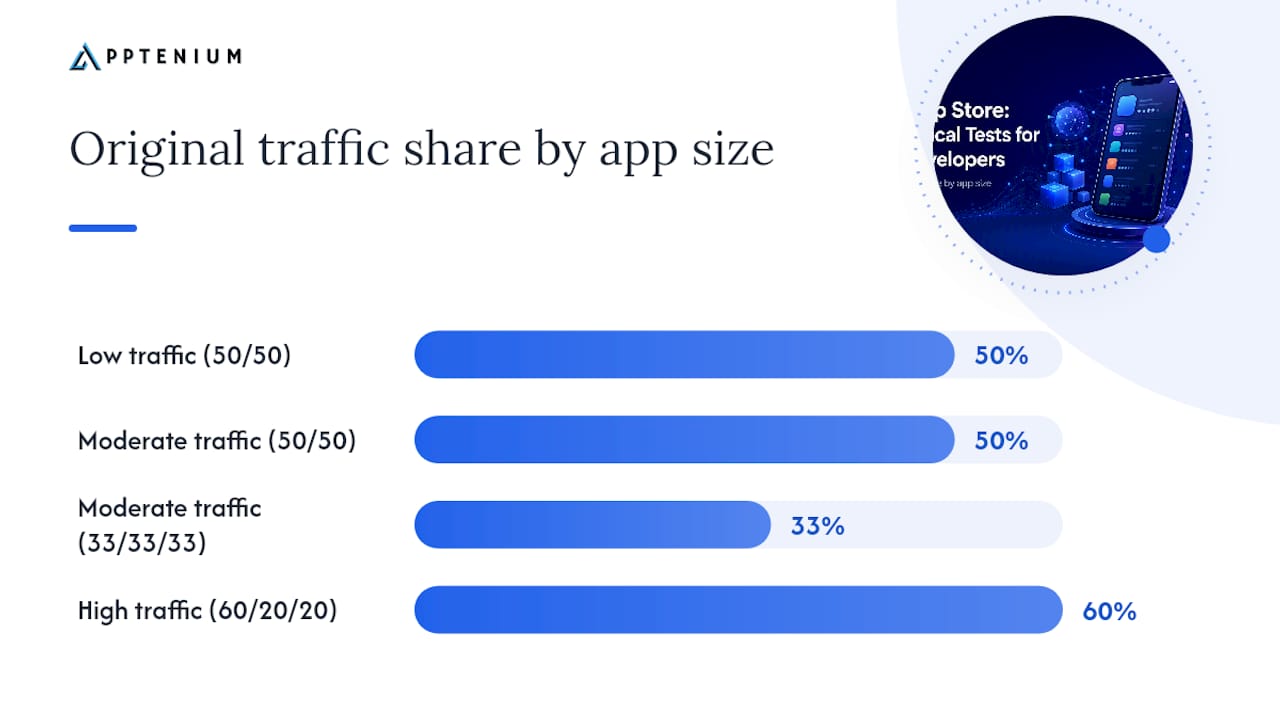
Traffic allocation and duration by app size:
Low traffic (under 500 daily organic impressions): use a 50/50 split, plan for an extended period, and accept that results may be inconclusive.
Moderate traffic (500–5,000 daily impressions): a 50/50 or 33/33/33 split typically reaches signal in about one to two weeks, though always confirm with impression counts.
High traffic (5,000+ daily impressions): you can afford a conservative split (e.g., 20% to each treatment, 60% on original) and still reach confidence within two weeks.
Common mistakes to avoid:
Stopping a test early because it “looks good” after a few days.
Running a test during a major traffic spike (a feature, a press mention, a seasonal event) that skews your organic audience.
Testing three treatments simultaneously when your traffic can only support one reliable comparison.
Forgetting to document what you tested and what you learned.
Pro Tip: Keep a simple test log: date started, asset category, hypothesis, traffic split, result, and confidence reached. After five or six tests, patterns emerge — certain visual directions consistently outperform others in your category, and that knowledge is worth more than any single test result.
What developer stories tell us about realistic PPO outcomes
Apple has published developer stories illustrating PPO results, and the picture they paint is encouraging but not dramatic. Icon changes tend to produce the most consistent lifts because the icon affects impressions at the top of the funnel.
The honest framing is this: PPO is not a shortcut to doubling installs overnight. A single icon test producing a double-digit relative lift is a strong result. Many tests produce smaller lifts or inconclusive outcomes, and that’s still useful data. An inconclusive result tells you the change didn’t matter to your audience, which narrows your next hypothesis.
Practitioner playbooks consistently note that PPO’s real value compounds over a testing program, not a single test. Three or four well-designed tests per year, each building on the last, can produce a product page that converts substantially better than the one you started with.
How ASO tools and Apptenium fit into your PPO workflow
PPO doesn’t exist in isolation. The tests you run are only as good as the hypotheses you bring to them, and those hypotheses come from understanding what’s working in your category and what your current page is missing.
Pre-test preparation:
Use an icon generator to produce three distinct icon directions in correct iOS sizes, exported as Xcode-ready assets with the right naming for Info.plist inclusion.
Run an ASO scan on your current listing to identify weak metadata signals and screenshot copy that doesn’t match your top keyword clusters.
Review top-performing apps in your category using category benchmarks to identify visual patterns that convert well, then build your treatment hypotheses around those signals.
During the test:
Monitor unique impressions and conversion rate in App Analytics daily.
Check retention signals and cohort quality in a third-party analytics integration (Firebase or Google Analytics) to confirm that installs from the winning treatment are not lower quality than your baseline.
For teams using App Store Connect API integrations, automating asset uploads and test scheduling reduces manual overhead on multi-app portfolios.
Post-test:
Record the winner in your experiment log with the confidence level, impression count, and relative lift.
Export the winning assets and promote the treatment in App Store Connect.
Feed the result back into your ASO scan to see whether the conversion improvement is reflected in your keyword ranking signals over the following weeks.
Workflow StageKey ActionToolPre-testGenerate icon variants, run ASO scanApptenium icon generator, ASO scanPre-testBenchmark category visualsApptenium top-apps dataDuring testTrack impressions and conversionApp AnalyticsDuring testMonitor cohort qualityFirebase / Google AnalyticsPost-testLog result and promote winnerApp Store Connect, experiment log
Why PPO belongs at the center of every ASO program
PPO is the most direct conversion lever available in the App Store, and it’s free. Most developers treat it as an occasional experiment. The ones who treat it as a continuous program, running three to five tests per year with documented hypotheses and logged results, build a compounding advantage that’s hard to replicate through keyword optimization alone.
The conventional wisdom says “optimize your metadata first.” That’s not wrong, but it’s incomplete. Metadata drives impressions. PPO converts them. Both matter, and neither works as well without the other. An app buried in search results needs better keywords. An app with strong impressions but weak conversion needs PPO. Most apps need both, running in parallel.
What I see consistently is that developers underestimate how much the icon alone moves the needle. It’s the first visual signal a user processes, often before they read the app name.
Apptenium makes PPO faster from hypothesis to promoted winner
Running PPO tests well requires three things: strong asset variants, reliable impression tracking, and a system for logging what you learn. Apptenium covers all three in one place.
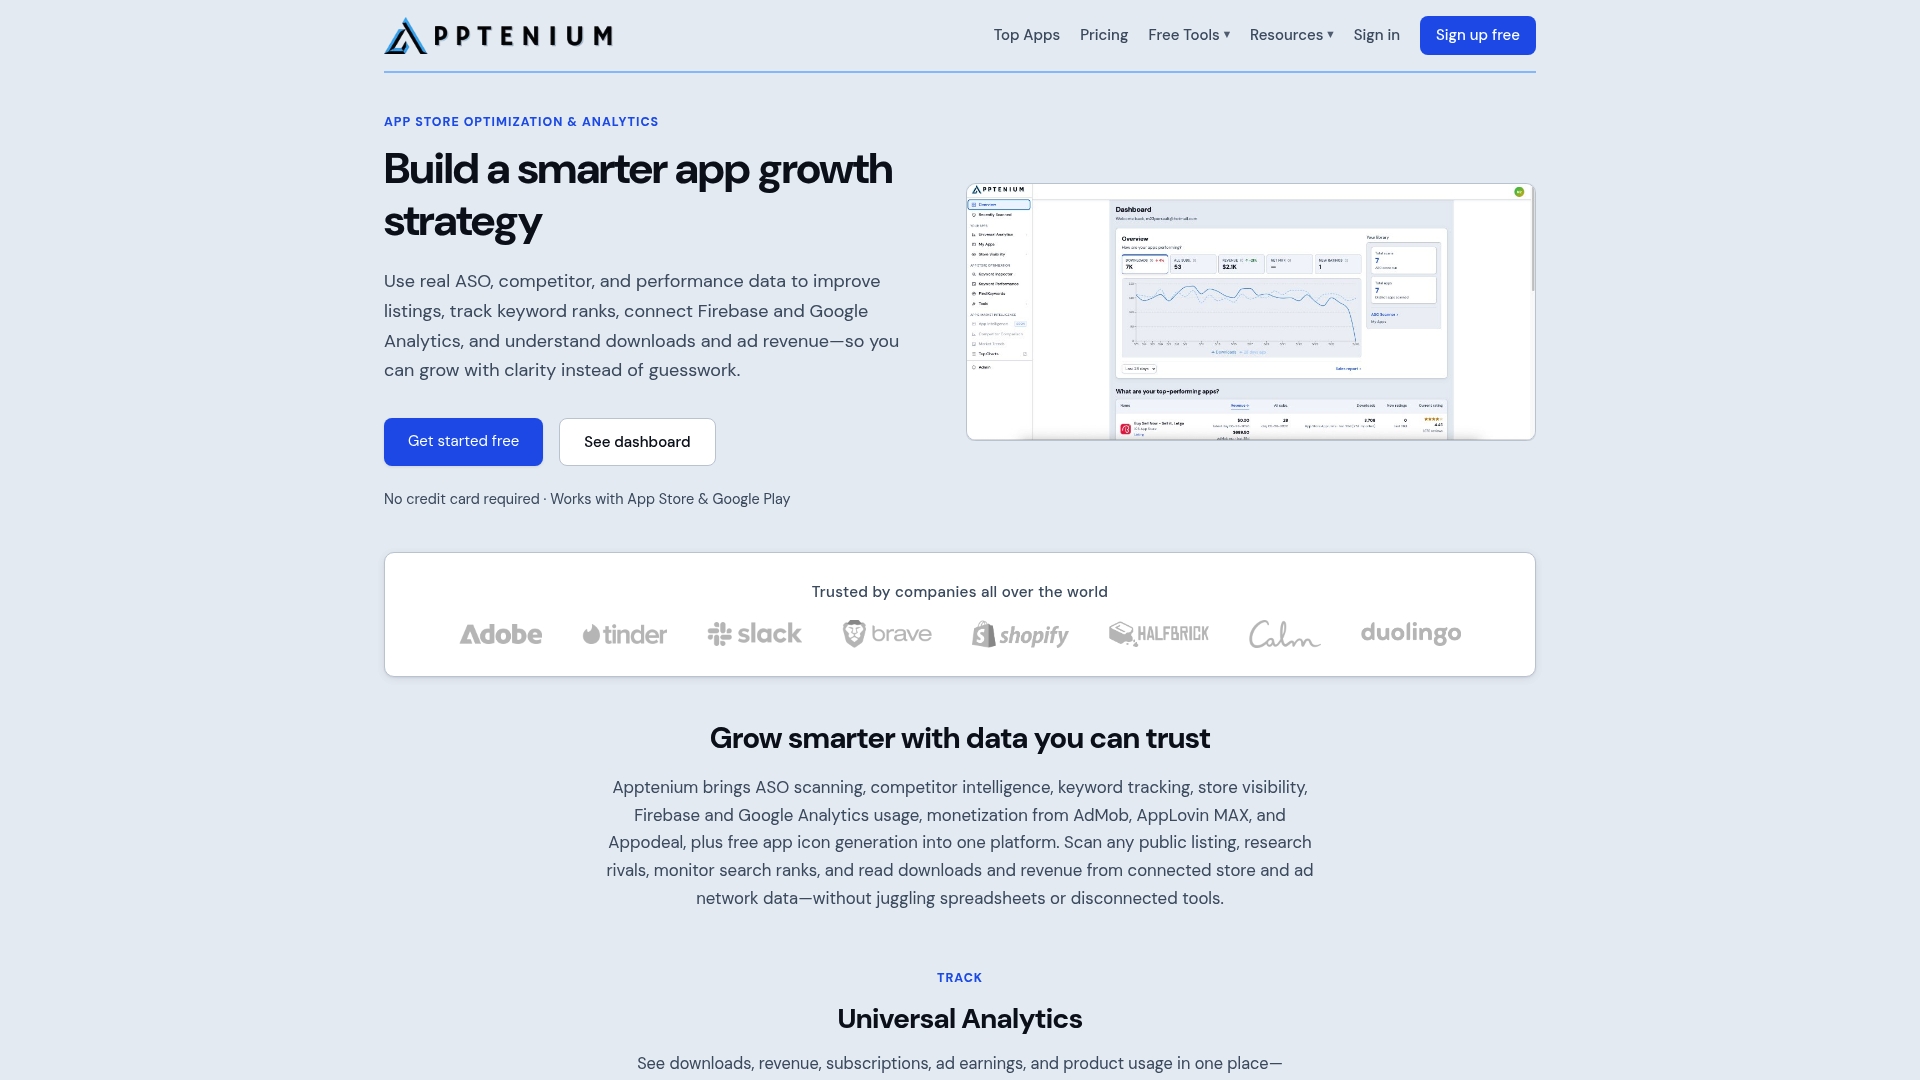
The Apptenium platform gives you an AI-powered ASO scan that identifies exactly where your product page is losing conversion, a free icon generator that exports Xcode-ready variants sized for every iOS device, and analytics integrations with Firebase and Google Analytics so you can track cohort quality alongside your App Analytics data. Instead of piecing together three separate tools, you get a single dashboard that connects your keyword performance, your visual asset testing, and your install quality signals. Start with a free scan of your current listing and see which elements PPO should target first.
Sources
These are the primary references for PPO setup, configuration, and test strategy:
FAQ
What is product page optimization in the App Store?
Product Page Optimization (PPO) is Apple’s built-in A/B testing feature that lets you test up to three alternate versions of your app icon, screenshots, or preview video against your live listing and promote the best-performing version to all users.

How do I access PPO in App Store Connect?
Sign in at appstoreconnect.apple.com, select your app, go to Features, and choose Product Page Optimization. Your app must be in “Ready for Sale” status and users must be on iOS 15 or iPadOS 15 or later to see treatments.
How long should a PPO test run?
Tests run up to 90 days. For low-traffic apps (under 500 daily organic impressions), plan 30–60 days. Moderate-traffic apps can reach reliable signals in about one to two weeks. Always base your decision on confidence level and impression count, not elapsed time alone.
What does App Store Connect used for in PPO?
App Store Connect is where you create, configure, and monitor PPO tests.
Does PPO work with paid Apple Search Ads traffic?
No. PPO runs on organic App Store traffic only. Paid Apple Search Ads impressions are excluded from the experiment, so results reflect how organic users respond to your product page assets.