Resolve Store Listing Experiments in 7–14 Days with an Apptenium Workflow

Resolve Store Listing Experiments in 7–14 Days with an Apptenium Workflow
Store Listing Experiments are Google Play Console’s built-in A/B testing tool for your app’s listing assets, and the metric that should decide every winner is unique user install clicks alongside click-through rate (CTR). Run them whenever you want to validate a new icon, screenshot set, or description before rolling it out to every visitor, and treat every other console number as context, not the verdict.
TL;DR:
- Testing the app icon and first screenshot typically yields the largest conversion improvements, making them high-priority assets for experimentation.
- Experiment duration depends on daily traffic, ranging from one to six weeks, and splitting traffic evenly accelerates statistical confidence.
- A confidence level of 90% or higher with a positive confidence interval suggests a reliable winner, but results should be confirmed with retention and engagement data.
- Localized experiments are essential because performance varies across languages and regions, and testing assets like visuals and copy separately improves relevance.
- Using tools like Apptenium alongside Play Console helps identify weak assets, generate ideas, and validate true winners by tracking post-install behavior.
Table of Contents
- What Are Store Listing Experiments, and What Can You Test?
- What Should You Test First? A Prioritized Roadmap
- How Do You Set Up an Experiment in Play Console?
- How Do You Read the Results and Decide a Winner?
- How Long Should a Store Listing Experiment Run?
- What Experiment Design Habits Actually Improve Results?
- Why Do Some Winning Experiments Turn Out to Be False Wins?
- How Apptenium Fits Into an Experiment Workflow
- Try Apptenium’s Free Plan to Run Smarter Store Listing Experiments
- Core Documentation to Consult Before You Test
- Sources
- FAQ
What Are Store Listing Experiments, and What Can You Test?
Store Listing Experiments live inside Play Console under your app’s “Store presence” section, where you can run two kinds of tests: default experiments that apply to every visitor regardless of language, and localized experiments scoped to specific locales. That distinction matters because an icon might convert well in English markets and flop in Japanese or German ones, and localized testing is the only way to know.
You can test the following assets:
- App icon
- Feature graphic
- Screenshots (including order and count)
- Short description
- Full description
Price experiments are handled separately from listing-asset experiments, with their own rulebook. They’re app-level only, require Manage Store Presence and View Financial Data permissions, allow a maximum of two price variants plus a control, and apply per selected country or region rather than globally. If you’re only testing creative assets, you can ignore most of that complexity, but it’s worth knowing the boundary exists before you assume every experiment type follows the same permission rules.
One structural limit shapes how you plan: Google recommends isolating a single asset per experiment so you can actually attribute a conversion change to that one element instead of guessing which variable moved the needle.
What Should You Test First? A Prioritized Roadmap
Not every asset deserves equal attention. Some move conversion rates dramatically; others barely register. Here’s a practical order based on where impact tends to concentrate:
- App icon. It’s the first thing a browsing user sees, both in search results and on the listing page itself, so a weak icon caps every other optimization you make downstream.
- First screenshot. Most users never scroll past image one or two, which means your opening screenshot is doing the heaviest lifting of any single asset besides the icon.
- Screenshot ordering and composition. Sometimes the assets are fine, but the sequence buries your strongest selling point behind three generic feature shots.
- Feature graphic. This matters more on Android TV and in certain promotional placements, but it still shapes first impressions in some surfaces.
- Short description. It appears above the fold and often doubles as ad copy, so testing headline framing here can shift both installs and expectations.
- Full description. It influences intent-heavy users and search relevance more than raw conversion, so treat it as a slower, longer-horizon lever.
Pro Tip: Industry guidance consistently points to the icon and first screenshot as the assets most likely to produce the largest conversion swings, so if you can only run one experiment this quarter, start there.
Designing a meaningful variant is where most teams stumble. A “big idea” test, swapping a feature-focused icon for a benefit-focused one, or replacing a UI screenshot with a lifestyle image, tends to produce detectable results. A cosmetic tweak, shifting a button’s shade of blue or nudging text two pixels, usually doesn’t generate enough signal to reach statistical confidence within a reasonable timeframe. If your app gets modest daily traffic, this distinction isn’t optional. Small changes on small samples take weeks or months to resolve; bold changes resolve faster because the effect size is larger relative to normal day-to-day noise.
Think of experiment design the way you’d think of a headline in an ad: you’re testing the idea, not the font. If two variants look nearly identical to a stranger scrolling past them, the experiment is unlikely to tell you anything useful, no matter how long you let it run.
How Do You Set Up an Experiment in Play Console?
Setting up a Store Listing Experiment is mechanically simple, but the details around traffic allocation and recordkeeping determine whether your results are trustworthy later. Here’s the flow:
- Open Play Console and navigate to your app, then find “Store presence” followed by “Store listing experiments.”
- Choose your experiment type. Decide whether you’re running a default experiment or a localized one scoped to specific languages or countries.
- Select the asset to test. Pick one: icon, feature graphic, screenshots, short description, or full description. Resist the urge to bundle two assets into one test.
- Upload your variant. Keep your control unchanged and upload only the new version you want to compare against it.
- Preview both versions as they’ll appear to real users, checking that nothing renders oddly on different screen sizes or locales.
- Set traffic allocation. A 50/50 split typically reaches statistical confidence fastest, since it maximizes the sample size on each side of the comparison. Skewed splits (say, 80/20) are useful when you want to limit exposure to a risky variant, but they extend how long you’ll need to wait for a clear result.
- Launch the experiment and let it run for a minimum of seven days, since Google’s own guidance flags that shorter windows miss weekday-weekend behavior swings that distort early readings.
Before you launch, write down four things somewhere outside the console itself:
- Your hypothesis (what you expect to change and why)
- The single target metric you’re using to judge the winner
- The exact start date and planned minimum duration
- A screenshot or export of both variants, for audit purposes later
That last point sounds bureaucratic until six months from now, when someone asks why the icon changed and nobody remembers the original test’s reasoning. A simple spreadsheet log solves this permanently.
How Do You Read the Results and Decide a Winner?
Play Console reports several distinct metrics, and conflating them is the fastest way to misjudge a test. The core numbers are unique user install clicks, unique user open clicks, unique user pre-registration clicks, and CTR, plus scaled installs and percentage difference between variants.

Unique user install clicks measure how many distinct users tapped install after viewing your listing, which is the metric most directly tied to conversion. CTR measures how often people who saw your listing (via search, browse, or an ad) clicked through to it at all, which is a different signal, more about discoverability and thumbnail appeal than final conversion intent. Unique user open clicks and pre-registration clicks matter mainly for apps still building anticipation before launch.
Confidence is where most people get impatient. Play Console shows a confidence percentage alongside a confidence interval for each variant’s lift or drop, and the platform’s own reporting flags roughly 90% and above as the threshold worth acting on, with 95% reserved for changes you can’t easily reverse, like a full rebrand of your icon.
Statistically speaking: a result sitting at 90% confidence with a lower confidence interval bound above zero means you can be reasonably sure the observed lift isn’t random noise, though it’s not the same certainty as a 95%+ read on a large, hard-to-undo change.
Use these decision rules as your default:
- Apply the variant when confidence is 90% or higher and the lower bound of the confidence interval is above zero.
- Extend the test when confidence sits between 70% and 90%, since more traffic may resolve the ambiguity either way.
- Keep the control when the data clearly favors it, or when confidence stalls below 70% even after a reasonable extension.
Resist the temptation to call a winner the moment the percentage looks favorable. A variant showing a promising lift at day three can flip by day ten once weekend traffic patterns even out.
How Long Should a Store Listing Experiment Run?
Duration planning comes down to daily traffic volume, and Google’s guidance breaks it into three rough bands. Apps seeing 500 or more store-listing visitors a day can often resolve an experiment in 7 to 14 days. Apps in the 100 to 500 daily visitor range typically need two to three weeks. Anything under 100 visitors a day should expect four to six weeks or longer, particularly if the tested change is subtle.
| Daily store-listing traffic | Expected experiment duration | Best-suited change type |
|---|---|---|
| 500+ visitors/day | 7–14 days | Any asset, including subtle variants |
| 100–500 visitors/day | 2–3 weeks | Moderate to bold changes |
| Under 100 visitors/day | 4–6+ weeks | Bold, high-contrast changes only |
The size of the lift you’re trying to detect also drives timeline.
Variant count compounds this math fast. Testing three variants against a control instead of one splits your traffic four ways instead of two, which roughly doubles or triples how long you’ll need to reach the same confidence level. Low-traffic apps should test one variant at a time rather than spreading thin samples across multiple ideas simultaneously.
What Experiment Design Habits Actually Improve Results?
The teams that get consistent value from Store Listing Experiments tend to follow the same handful of habits, and the teams that don’t usually violate one of these without realizing it.
- Write a specific hypothesis before you launch anything, not after you see early results that need explaining.
- Pick one primary metric in advance and hold yourself to it, rather than switching to whichever number looks best once the test is running.
- Change one asset at a time, and make that change substantial enough to be visually obvious to someone scrolling quickly.
- Localize tests where markets genuinely differ in language, imagery expectations, or cultural framing, rather than assuming a global default will perform evenly everywhere.
- Log every experiment’s configuration, including traffic split and locale scope, so a mixed or regional result makes sense months later.
- Treat experimentation as an ongoing cadence rather than a one-time fix. Iterative testing compounds improvements over time the same way compounding interest works. Small, consistent wins stack up in a way one big overhaul rarely matches.
Pro Tip: If you’re testing short-description copy, borrow structure from proven direct-response formats. A resource like this Instagram call-to-action guide breaks down phrasing patterns that translate surprisingly well to app store copy, even though it’s written for a different platform.
Localization deserves extra weight here. A screenshot sequence that leads with a productivity angle might resonate in the US market while a value or price-savings angle performs better elsewhere. Running one global test and applying the winner everywhere often leaves gains on the table in markets you never tested separately.
Why Do Some Winning Experiments Turn Out to Be False Wins?
An experiment can report a clear installation lift and still be a net loss for your app. This happens more often than most teams expect, and it’s almost always a downstream problem rather than a flaw in the experiment itself.
- Check day-1 and day-7 retention for each variant before rolling out a winner broadly, since a flashier icon or screenshot can attract users who churn immediately.
- Compare in-app purchase rates and crash-free session counts between variants, because a listing that overpromises can quietly increase refund requests or one-star reviews.
- Never stop a test early just because early numbers look favorable; confidence intervals narrow with more data, and early leads frequently shrink or reverse.
- Don’t test differences too small to matter, since a variant that’s barely distinguishable from the control will rarely produce a result worth acting on either way.
- Avoid assuming a ranking or visibility change during the test period was caused by the experiment itself; seasonality, algorithm updates, and competitor activity all move rankings independently.
The fix is straightforward: pair your Play Console store listing performance reports with retention and engagement data from your analytics stack before declaring victory. A win on install clicks that survives a retention check is a real win. A win that doesn’t is just a more expensive way to acquire users who leave.
How Apptenium Fits Into an Experiment Workflow
Running a good experiment starts before you ever open Play Console’s testing panel, it starts with knowing which asset is actually weak. Apptenium’s ASO Scanner flags underperforming listing elements against competitor benchmarks, which gives you a data-backed starting point instead of a guess about whether your icon or your screenshots need attention first.
From there, Apptenium’s AI-powered recommendations speed up variant ideation, suggesting copy directions and creative angles for short descriptions or feature graphics so you’re not starting from a blank page every time you want to test something new. Once your experiment is live in Play Console, connecting Firebase and Google Analytics lets you check the retention and in-app behavior data that separates a genuine win from a false one, closing the loop between conversion metrics and what actually happens after install.
— Mike
Try Apptenium’s Free Plan to Run Smarter Store Listing Experiments
Apptenium gives app developers and marketers one place to diagnose listing weaknesses, generate AI-backed variant ideas, and connect the performance data that tells you whether a Play Console winner actually held up. Instead of juggling a scanner tool, a spreadsheet for competitor research, and a separate analytics dashboard, you get scan results, AI recommendations, and revenue and retention data pulled from Firebase and Google Analytics in a single view.
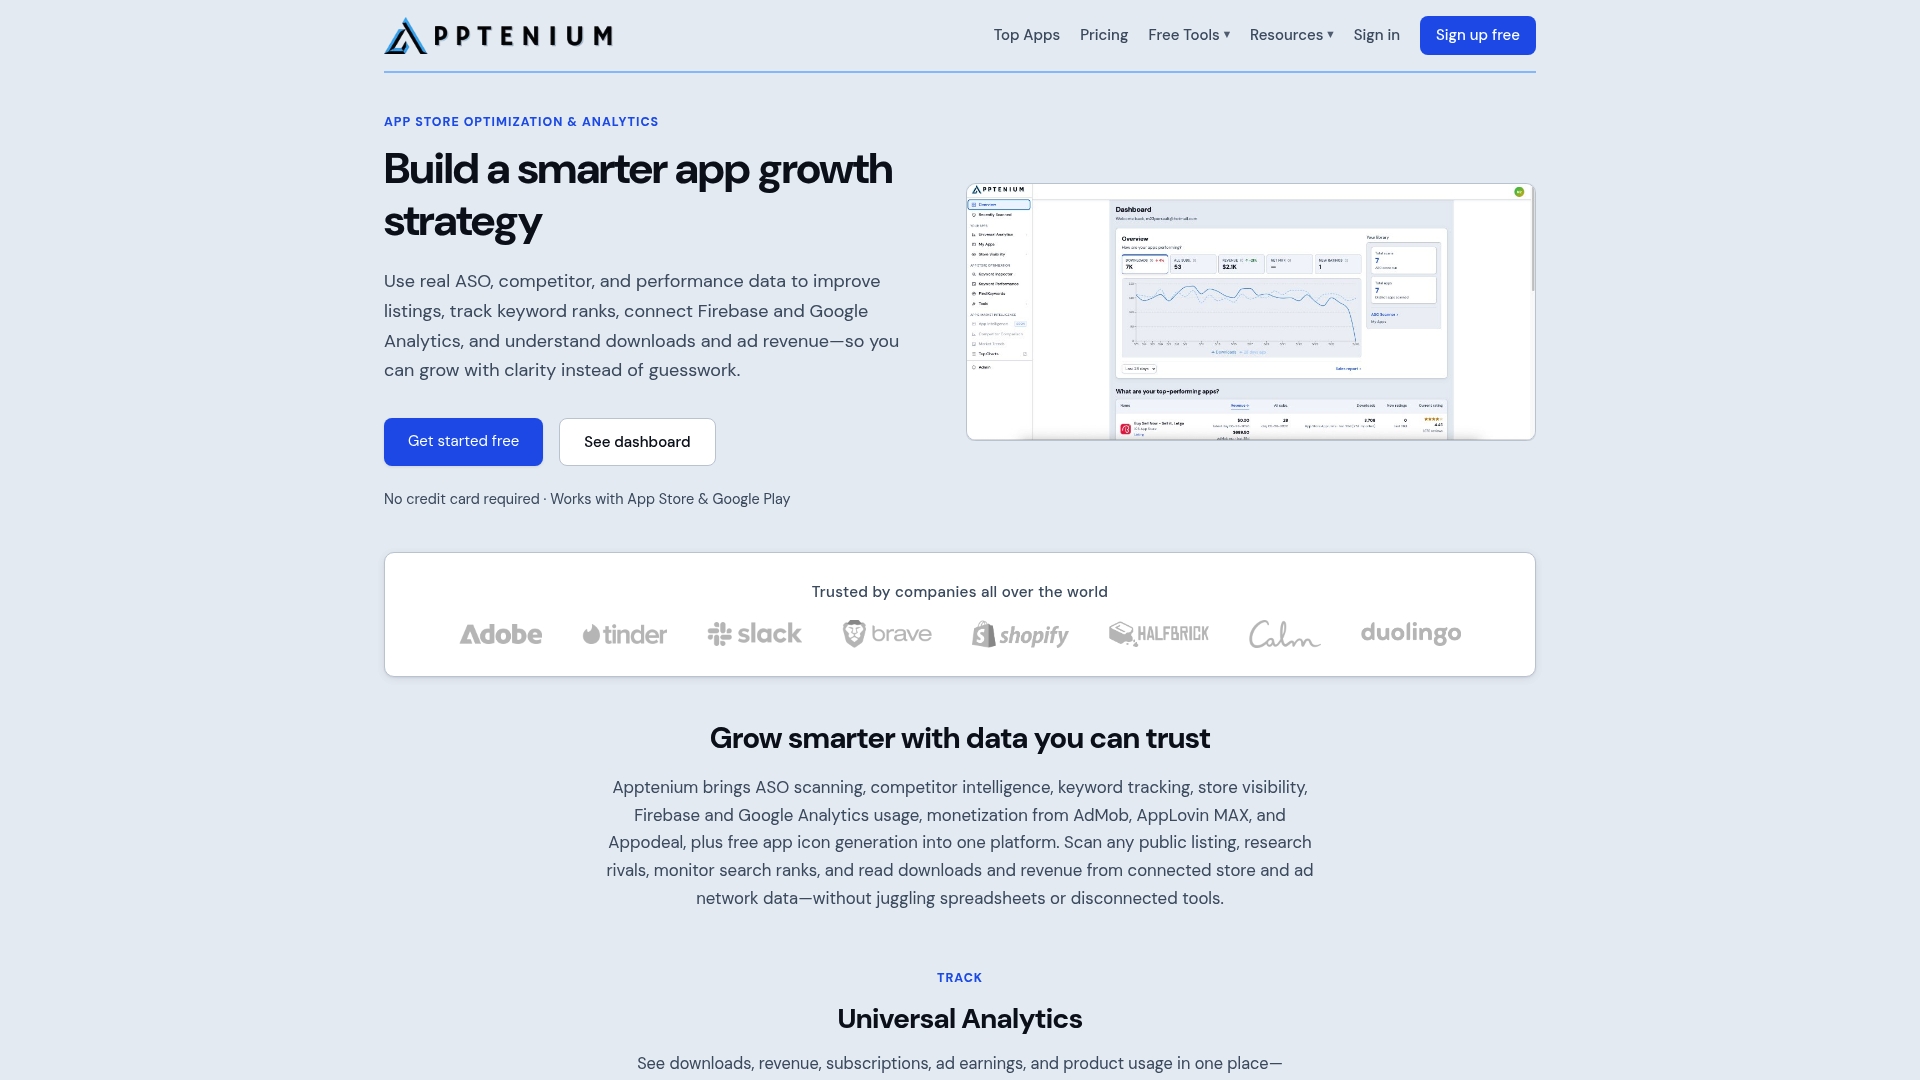
The Free plan lets you run a limited number of scans each month at no cost, enough to identify which asset deserves your next experiment. If you’re managing multiple apps or want unlimited scanning and the full set of AI recommendations, the Pro plan runs $9.99 per month. Either way, the next step is simple: run a free scan on your current listing, pull the AI-suggested fixes for your weakest asset, and take that variant straight into your next Play Console experiment.
Core Documentation to Consult Before You Test
A few official references cover most of what you’ll need while planning and running experiments:
- Store listing experiments overview — Google’s own explanation of experiment types, asset rules, and duration guidance.
- Store listing performance reports — metric definitions and filtering options for deeper analysis.
- Price experiments support page — required reading if you’re testing one-time product prices rather than creative assets.
Sources
- Store listing experiments | Google Play Console
- Store listing performance reports — Google Play Console support
- Price experiments — Google Play Console support
- Storelit
FAQ
How many localized store listing experiments can run at once?
Google Play allows multiple localized experiments to run simultaneously across different locales, though each locale typically supports one active experiment at a time for a given asset. Check the Store listing experiments documentation for the current limits tied to your account, since caps can vary by app size and history.
What is a Google experiment in the Play Console context?
A Google Play experiment, more precisely a Store Listing Experiment, is a native A/B test that shows different versions of a listing asset to separate groups of visitors and measures which version converts better. The console tracks unique user install clicks and CTR to determine a statistically confident winner.
What is a custom store listing?
A custom store listing is a version of your app’s page tailored to a specific audience, traffic source, or campaign, distinct from your default listing. Developers use custom listings alongside experiments to match messaging to where traffic originates, such as a paid ad campaign versus organic search.
What are the requirements for a Google Play Store app listing?
A standard Play Store listing requires an app icon, a short description, a full description, and at least two screenshots, along with compliance with Google’s content and metadata policies. Store Listing Experiments let you test variations of these same required assets against a control before committing to a permanent change.
Does Apptenium help identify what to test in a store listing experiment?
Yes. Apptenium’s ASO Scanner flags weak or underperforming listing assets so you know which one to prioritize before you build a Play Console experiment, and its AI recommendations speed up generating the variant itself.