How to Track App Downloads Across Every Platform You Ship On

The most accurate way to track app downloads is to combine official store consoles (App Store Connect and Google Play Console) with platform-level attribution (the Install Referrer API on Android, SKAdNetwork on iOS) and campaign tagging, then unify everything in a single dashboard. This gives you numbers you can audit, not just numbers you hope are right.
The unified approach wins because store consoles alone tell you what happened, but not why — you need referrer data and campaign tags to know which channel earned the install.
Start with these before anything else:
Console access to App Store Connect and Google Play Console for every app you ship
Google Play Install Referrer implementation on Android
Awareness of SKAdNetwork’s reporting limits before you build iOS campaign dashboards
UTM or campaign-link tagging on every ad and marketing URL
A dashboard, ASO tool, or BI setup to unify the numbers monthly.
Pro Tip: Set up your dashboard before you launch your first paid campaign. Retrofitting attribution onto three months of untagged traffic is a much harder problem than tagging it from day one.
Key Takeaways
Reliable app download tracking depends on pairing official console data with platform-level attribution and reconciling both against a single dashboard monthly.
PointDetailsUse consoles as ground truthPull first-time downloads separately from redownloads in App Store Connect and Google Play Console.Implement platform attributionUse the Install Referrer API on Android and SKAdNetwork awareness on iOS before running paid campaigns.Tag every campaign linkApply UTM parameters consistently so installs trace back to a specific channel.Reconcile monthlyCompare dashboard totals against console totals to catch double-counting or export gaps early.Unify with a single platformApptenium normalizes store, Firebase, and Google Analytics data into one dashboard for downloads and campaign attribution.
Where to Verify Everything in This Guide
App Analytics for Apple’s official metric definitions
Google Play Install Referrer for Android attribution implementation
Play Console statistics for peer benchmarking and reporting
Bookmark these three pages. They’re the implementation contract everything else in this guide builds on.
Table of Contents
Where Official Download Numbers Actually Come From
Your two ground-truth sources are App Store Connect and Google Play Console, and they don’t count downloads the same way.
App Store Connect reports Total Downloads as the sum of First-Time Downloads and Redownloads. It excludes iCloud restores and auto-downloads pushed to a user’s other linked devices, so a customer who owns three iPhones doesn’t inflate your numbers just by syncing them. Apple attributes each download to a source, such as App Store Search, App Store Browse, app referrers, web referrers, or custom campaign links, which you can review on the App Analytics dashboard. Conversion rate here is defined specifically as total downloads divided by unique impressions, a formula worth memorizing because it’s the number you’ll defend in every growth meeting.
Some downloads show up as “Unavailable” in the Acquisition report when they predate your analytics setup or came through a gift code, promo code, or MDM deployment. Don’t panic. That’s expected behavior, not a tracking failure.
Google Play Console splits its reporting across a few different pages. The Statistics page shows raw app statistics with configurable date ranges, while the release dashboard reports installs, uninstalls, updates, crashes, and ANRs per release, using metrics like “Installs on active devices.” Store analysis and Store listing conversion pages, meanwhile, isolate how your listing itself performs.
Export both platforms’ data on a schedule, not on demand. CSV exports and API pulls should run automatically so you’re never reconstructing history from memory.
Pro Tip: Always pull first-time downloads separately from total downloads when measuring acquisition. Total downloads alone can badly overstate how many genuinely new users you’re actually acquiring.
How Do You Attribute Installs to Ads and Campaigns?
Attribution is where most teams lose accuracy, and the fix looks different on Android than on iOS.
On Android, the Play Install Referrer API returns the referrer URL, the click timestamp, and the install start time, in seconds, directly from Google Play. It’s available on any device running Play Store version 8.3.73 or later, which by now covers nearly your entire user base. This is the single most reliable link between an ad click and an install for web and paid-traffic flows.

iOS works differently. Apple’s privacy model limits device-level tracking, so SKAdNetwork exists as a privacy-safe way to measure campaign performance without exposing individual user identity. It reports aggregated, delayed conversion data rather than a clean one-to-one click-to-install trail, so you need to design your campaign structure around that constraint rather than fight it.
To build a working attribution stack:
Tag every ad, social post, and email link with UTM parameters or dedicated campaign links.
Implement the Install Referrer API on Android and read the payload on first launch.
Configure SKAdNetwork conversion values for iOS campaigns before you spend a dollar on iOS ads.
Route campaign parameters through Google Analytics’ campaign collection framework or Firebase so installs tie back to marketing sources automatically.
Decide whether you need a Mobile Measurement Partner SDK, which is usually worth it once you’re running paid campaigns across more than two ad networks and need cross-network deduplication.
Pick your attribution window deliberately (commonly 1 to 7 days for clicks) and keep server and client timestamps aligned, or your reports will quietly drift out of sync.
Pro Tip: If you’re only running organic and a handful of owned channels, skip the MMP. Console data plus Install Referrer covers you. Add an MMP when paid spend crosses multiple networks and manual reconciliation starts eating hours every week.
What’s the Best Way to Unify Store and Campaign Data?
You have three realistic paths to a single reporting view: direct API pulls scheduled into your own database, scheduled CSV exports feeding a spreadsheet or lightweight BI tool, or a dedicated ASO/analytics platform that ingests everything for you. Near-real-time refresh matters more than it sounds. Industry data suggests that marketers optimizing paid spend need fast visibility into installs and revenue, not a report that arrives three days after the budget’s already spent.
ApproachBest fitTradeoffSpreadsheets + manual exportsSolo developers, pre-revenue appsCheap but slow, and error-prone at scaleScripts + lightweight BISmall teams comfortable with SQLFlexible, but someone has to maintain itUnified SaaS dashboardGrowth-stage teams and agenciesFastest setup, normalized data out of the box
Whichever path you choose, look for normalized store metrics, campaign-level attribution matching, retention and lifetime-value joins, and clean export or API access.
Pro Tip: Reconcile store totals against your dashboard every month using first-time downloads as your anchor number. A simple delta report catches double-counting or a broken export before it corrupts a quarter of reporting.
Step-by-Step: Setting Up Reliable Download Tracking
Run through these in order the first time you set up tracking on a new app:
Grant console access to every teammate who needs App Store Connect or Play Console data.
Enable analytics inside both consoles and confirm the app metrics are populating.
Implement Install Referrer reading on Android and confirm the payload arrives on first launch.
Add SKAdNetwork conversion value logic on iOS if you’re running paid campaigns.
Tag every campaign URL with UTM parameters or dedicated campaign links.
Wire first-open events into Firebase or Google Analytics so installs tie back to sources.
Schedule automated exports from both consoles, weekly at minimum.
Build the reconciliation report comparing dashboard totals to console totals.
Run a smoke test: click your own ad, install on a test device, confirm the referrer payload matches.
For validation, simulate installs on test devices, inspect the raw referrer payload before trusting the dashboard, and confirm your first-time-download count matches expectations before you scale spend.
Daily: check for export failures or zero-download days that signal a broken pipeline.
Weekly: reconcile campaign spend against attributed installs.
Monthly: full audit against console totals.
Pro Tip: Keep one test campaign running permanently at minimal spend. It gives you a live, known-good signal to check against whenever something looks off in the dashboard.
How Should You Interpret and Benchmark Download Numbers?
Raw totals lie by omission. First-time downloads, redownloads, total downloads, conversion rate, installs per campaign, retention cohorts, and installs-on-active-devices each answer a different question, and mixing them up is how teams celebrate a metric that means nothing.
Statista’s aggregated figures on global App Store and Google Play download volume are a useful scale check. If your growth curve looks impressive in isolation but flat against the category’s overall trajectory, that context changes the story.
Apple explicitly recommends peer-group benchmarking rather than judging absolute numbers, and Play Console’s Statistics page includes a “Compare to peers” tab that does the same normalization for Android. A 5% week-over-week download increase means something different for a five-year-old app in a saturated category than for a two-month-old app in an emerging one.
Pro Tip: Track conversion rate on your product page and segment it by traffic source. A channel with lower volume but higher conversion often deserves more budget than your biggest traffic driver.
Common Tracking Problems and How to Fix Them
Most bad numbers trace back to a short list of repeat offenders:
Console reporting delays that make same-day numbers look artificially low
Double-counting when console totals and MMP totals both get reported as “downloads” without reconciliation
Missing or malformed referrer payloads on Android, usually from an outdated SDK
SKAdNetwork’s aggregated, delayed reporting getting misread as a real-time signal
Device or account privacy settings blocking attribution signals before they reach your SDK
Timezone mismatches between Pacific Time console data and your own reporting stack
To debug, check SDK versions first, then inspect a raw referrer payload directly, then compare first-open events against console downloads for the same day, then confirm your exports didn’t silently truncate.
Pro Tip: Keep one documented test flow, ad click to store page to install to first open, and rerun it whenever a number looks wrong. It isolates the broken link faster than staring at dashboard totals.

What Small Teams Should Prioritize First
If you’re capacity-constrained, get first-time downloads and campaign tagging right before anything else. Skip cohort analysis until the basics are solid: consoles, Install Referrer, UTMs, one dashboard. Everything else can wait.
Bring Store Metrics and Campaign Data Into One Dashboard
Everything covered so far, console exports, referrer payloads, SKAdNetwork conversion values, campaign tags, works, but stitching it together manually is where most teams burn hours every month. Apptenium ingests your App Store Connect, Google Play Console, Firebase, and Google Analytics data directly, normalizes first-time downloads against redownloads automatically, and surfaces campaign-level attribution alongside your ASO performance in one view.
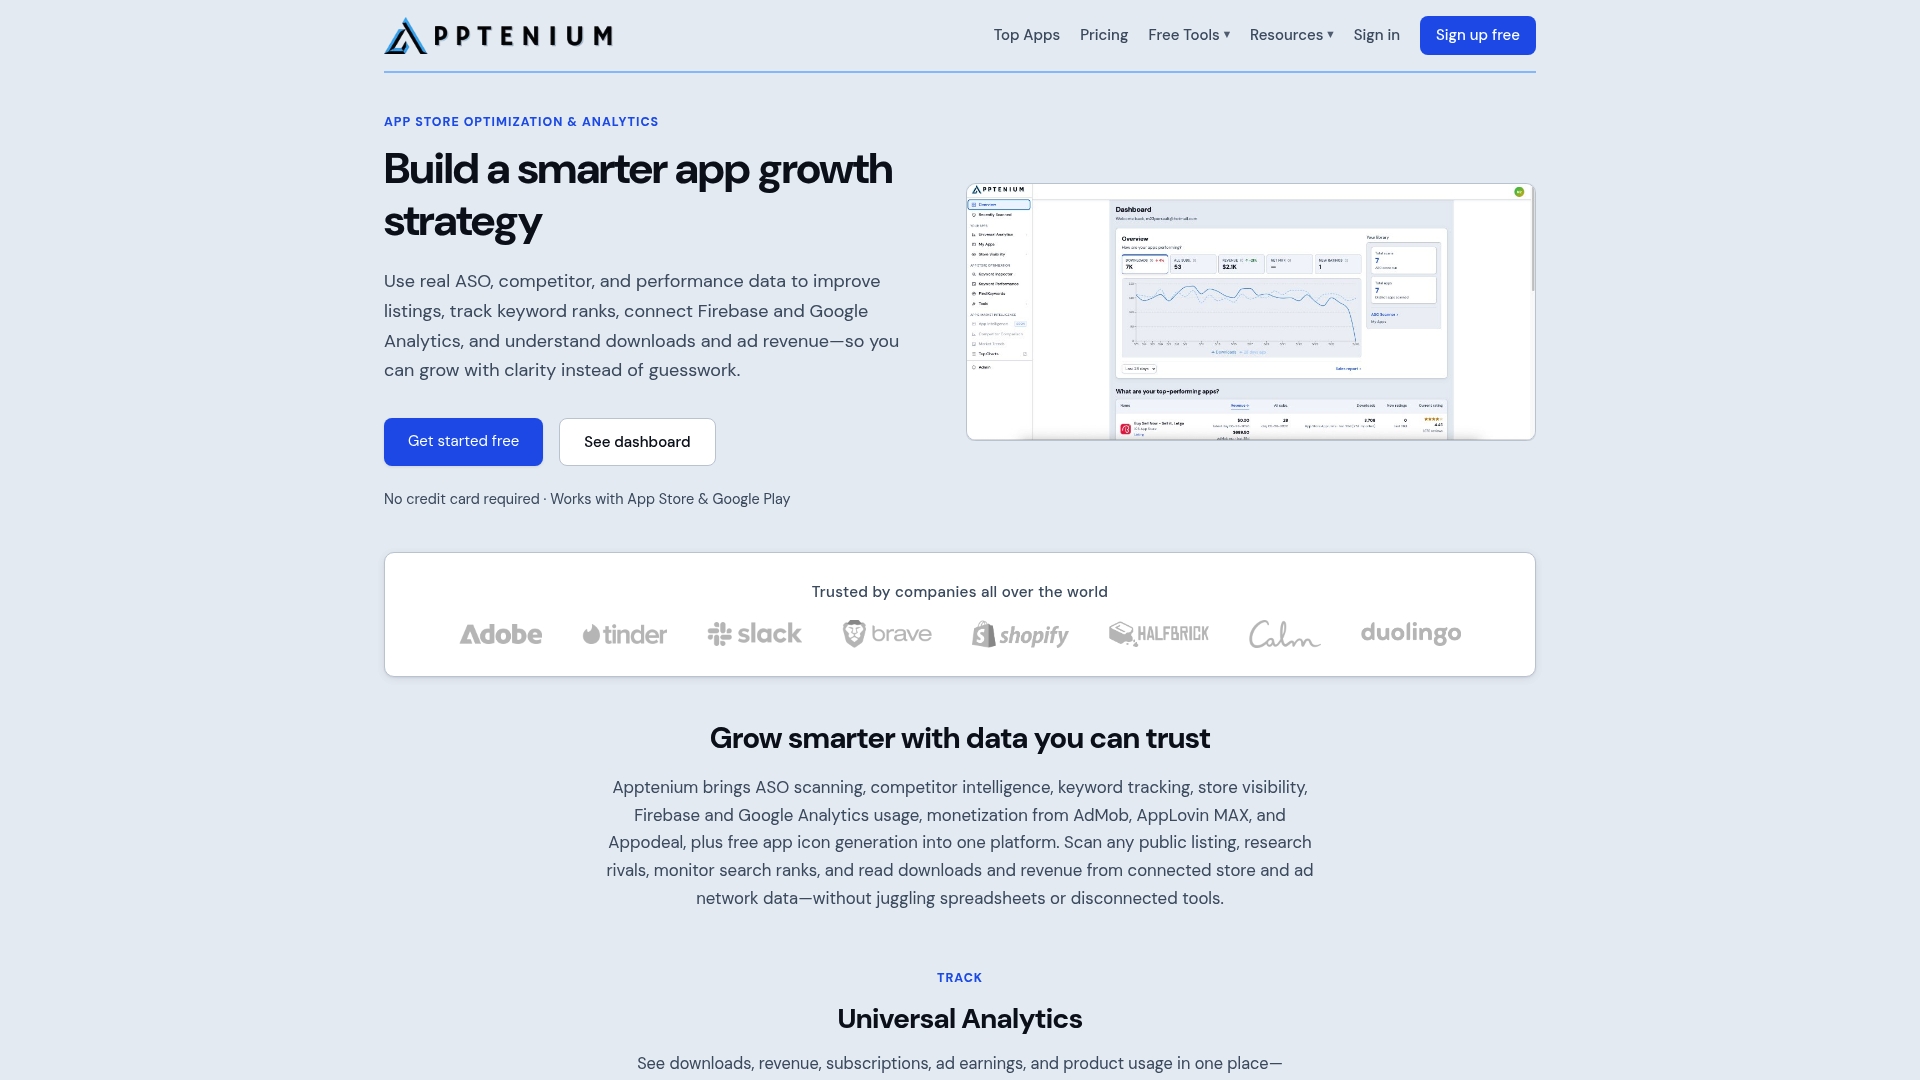
That means the reconciliation report you’d otherwise build in a spreadsheet, comparing console totals to dashboard totals, comes built in, along with keyword tracking and competitor intelligence that connect discovery performance directly to your download numbers. If you’re running a lean team and want download tracking, attribution reconciliation, and ASO insight without maintaining a custom BI setup, Apptenium’s ASO platform is built for exactly that. Start with a free ASO scan to see how your current listing and download data line up.
Sources
FAQ
Is There a Reliable Way to Track App Downloads?
Yes. Combine App Store Connect and Google Play Console for ground-truth totals with Install Referrer on Android and SKAdNetwork awareness on iOS, then reconcile both into one dashboard monthly.
What’s the Best Tool for Tracking App Downloads?
It depends on team size: small teams often start with console exports and spreadsheets, while growth-stage teams typically move to a unified platform like Apptenium that normalizes store and campaign data automatically.
Where Can I See All My App’s Download Data in One Place?
App Store Connect and Google Play Console each show their own platform’s numbers natively, but a unified dashboard or ASO platform is the only way to see both stores and campaign attribution together.
How Do I Check Where My App Installs Are Coming From?
Check the Acquisition or Sources report in App Store Connect and the Store analysis page in Google Play Console. Both break installs down by source, including search, browse, and referral links.
Why Do My Download Numbers Differ Between My Dashboard and the Store Console?
This usually points to double-counting, a delayed export, or a missing referrer payload. Reconcile first-time downloads specifically, since that’s the metric most prone to drift between systems.