How to Track Organic Installs on iOS and Android

How to Track Organic Installs on iOS and Android
To track organic installs, start with each store’s own console, then layer an attribution or analytics source on top and read all of it by traffic source. Organic means the install came from store search, browsing or word of mouth rather than a campaign you can credit. The catch is that the App Store and Google Play define “organic” differently, so one number never tells the whole story.
This guide shows where the data lives on each platform, how to keep it clean, why reports disagree, and which metrics to read next to installs so you know whether growth is real.
TL;DR
- Organic installs are installs that no paid or tracked campaign gets credit for, so the number depends on your attribution rules.
- Google Play’s Search and Explore channels exclude paid traffic, while Apple’s Search and Browse sources can blend in Apple Search Ads, so separate that spend before you call anything organic.
- Use store consoles as your baseline, add an attribution or analytics layer, and compare trends rather than exact counts.
- Watch impressions, product page conversion, retention and revenue next to installs.
- Review weekly for direction and monthly for decisions, and tie changes to specific listing edits.
Table of Contents
- What counts as an organic install
- Where to find organic install data on each store
- Add an attribution or analytics layer
- Why dashboards disagree
- Metrics to watch beside organic installs
- How to segment and analyze the data
- How long it takes and how often to review
- Our perspective
- Track organic growth with Apptenium
- FAQ
- Sources
What counts as an organic install
An organic install is one you cannot tie to a paid or tracked source. In practice, attribution tools decide this with a look-back window: the period after an ad click or impression during which an install is still credited to that ad. Anything outside that window is treated as organic or credited elsewhere, which is why a longer window shrinks your organic count and a shorter one inflates it.
That has a practical consequence. Organic is a residual, not a directly measured channel. It includes the installs you earned through keyword rankings, featuring and ratings, but it can also include installs that a campaign influenced and your tools failed to catch. Treat the figure as a trend line you can compare month to month under the same rules.
Four kinds of installs commonly end up in the organic bucket:
- Store search: a user types a query and finds your listing.
- Store browse: a user finds you through categories, charts, featured placements or similar-app suggestions.
- Word of mouth and brand search: a user hears about you elsewhere and searches your name.
- Unattributed paid influence: a user saw an ad or post, did not click, and installed later.
The first two are what ASO moves. The last two are real but behave differently, so segmenting them tells you what your listing work actually did.
Where to find organic install data on each store
Apple App Store Connect
In App Store Connect, open your app, go to the Analytics tab and select Sources under Acquisition. Apple lets you see downloads from App Store search, App Store browse, app referrer, web referrer and custom campaigns. It also reports unique impressions, unique product page views and total downloads, split into first-time downloads and redownloads.
Two details matter for accuracy. Apple attributes sales, usage and subscription data to the source recorded when a user taps to download or redownload, and each manual redownload resets that source. Also, iCloud restores and auto-downloads onto other linked devices are not counted as downloads, so your App Store Connect total will rarely match a number built from your own SDK.
The bigger issue is paid traffic. Search and Browse in App Store Connect can include installs driven by Apple Search Ads, so to isolate true organic you need Apple Search Ads reporting alongside it. One practitioner write-up of cross-platform measurement describes the same asymmetry: Google Play’s Search and Explore are clean of paid traffic, while Apple’s are blended. If you run Apple Search Ads, subtract those installs from the Search and Browse totals and treat the remainder as your organic estimate.
Google Play Console
Play Console gives you statistics by acquisition channel and a way to explore them over time. The Play Console statistics help page describes a Change analysis chart that compares the first period with the final one and highlights the dimensions that changed most, which helps explain a trend instead of just showing it.
For traffic sources, the Explore channel covers discovery without a specific search for your app name, while a paid and direct group includes installs after a direct search for the app or brand and installs from paid campaigns. The practical reading: Search and Explore are your closest thing to ASO-driven organic, and the paid and direct group needs more care because brand searches and ads sit together.
Mozilla’s data documentation uses a similar definition for its own reporting: a “Play Store (organic)” channel counts unique users who saw the listing by browsing or searching in the Play Store app. That is a useful mental model for what the platform means by organic.
Side-by-side comparison
| Question | App Store Connect | Google Play Console |
|---|---|---|
| Where to look | Analytics, Acquisition, Sources | Statistics and acquisition reports |
| Organic-like sources | App Store search, App Store browse | Search and Explore channels |
| Paid contamination | Search and Browse can include Apple Search Ads | Search and Explore exclude paid traffic |
| Brand and direct traffic | Often mixed into search and referrers | Grouped with paid in the paid and direct tier |
| Redownloads | Reported separately from first-time downloads | Read installers and retention definitions carefully |
Add an attribution or analytics layer
Store consoles are the baseline, but they stop at the store door. They cannot tell you what a user did after the first open, and they do not connect installs to your revenue and ad data. That is where an attribution or analytics layer comes in.
A sound setup, in the order CoolCoding recommends it, uses platform-native install receipts as the source of truth first, such as the Play Install Referrer on Android and StoreKit or App Store Connect data on iOS, and then adds an attribution SDK on top. The store data answers “how many”, the SDK answers “from where and then what”.
If you also run offline or cross-channel promotion, give each one its own trackable entry point so it never leaks into the organic bucket. For example, app download QR codes that point to a changeable destination let you measure scans separately from store search, which keeps your organic baseline honest.
Firebase and Google Analytics are the usual way to bring in behavior after install. Connecting them to your store and ad data in one view is what turns an install count into an answer about quality.
Why dashboards disagree
Expect your numbers to differ, and know why before you chase a discrepancy. The common causes:
- Different definitions of a download. Apple excludes iCloud restores and auto-downloads from its download count, while an SDK usually counts first opens.
- Install versus open. A store counts the install. An SDK counts the moment the app first launches. Mozilla’s documentation notes that an installation does not mean the app was opened during a retention period.
- Attribution windows. A longer look-back credits more installs to ads and leaves fewer organic ones.
- Redownloads and reinstalls. If your tool lacks distinct flags for reinstall and new install, returning users inflate your organic number.
- Time zones and reporting periods. Consoles and SDKs may cut days at different boundaries, so daily figures shift even when weekly totals agree.
- Consent and privacy settings. On iOS, users who decline tracking reduce what an SDK can see, while the store console still counts them.
The fix is not to force the numbers to match. Choose one source for each question, write it down, and keep it constant. Use the store console for volume and source mix, and your analytics layer for behavior and revenue.
Metrics to watch beside organic installs
Installs alone can rise while the business stalls. Pair them with the metrics that show whether the listing and the product are working.
- Impressions and product page views. These show whether your keyword visibility is growing before installs move.
- Impression-to-download and page-view-to-download conversion. CoolCoding suggests measuring the funnel beyond store downloads, including impression-to-download rate and download completion rate. A falling rate with steady impressions points to a listing problem, not a ranking problem.
- First-open latency. The time between install completion and first open signals how many installs turn into real users.
- New versus reinstall flags. These keep your organic growth from being padded by returning users.
- Retention. Google Play’s data defines installers retained after 1, 7, 15 and 30 days, which lets you check that organic users stay. See the Mozilla data documentation for how those retained-installer measures are defined.
- Revenue and subscriptions per source. An organic install that never pays is a vanity metric. Segment revenue by acquisition source wherever your data allows.
How to segment and analyze the data
Segmentation is where tracking becomes useful. Work through it in this order:
- Split by store and by country. A rise in one market can hide a drop in another.
- Split by source. Search versus browse on iOS, Search versus Explore on Android.
- Remove paid influence. Subtract Apple Search Ads from Apple’s Search and Browse totals, and treat the paid and direct group on Play with care.
- Compare periods, not days. Use week-over-week and four-week comparisons, and use the Change analysis view in Play Console to see which dimension drove the move.
- Annotate changes. Log every title, subtitle, icon, screenshot or description edit with its date, so you can connect a movement in installs to a cause.
A worked example
Say your iOS app shows 2,000 App Store search downloads in a month, and your Apple Search Ads report shows 400 installs in the same period. Your organic estimate from search is about 1,600. Next month search reads 2,300 and ads read 700. The headline grew 15%, but the organic estimate is also 1,600. Nothing improved organically. That is the type of trap source separation removes. These figures are illustrative.

How long it takes and how often to review
There is no fixed timeline, and any firm number would be a guess. Organic installs respond to indexing of your metadata, your ranking for the keywords you target, your conversion rate and your ratings, so the lag depends on your category and competition. A new listing starts from zero visibility, and the early weeks are about getting indexed and ranking for low-competition terms.
A review rhythm that works for most teams:
- Weekly: check direction. Are impressions, product page views and installs by source moving up, flat or down?
- After each listing change: compare the periods before and after, giving the change enough time to be reflected in the store.
- Monthly: decide. Which keywords, creatives or markets deserve more effort?
Avoid reacting to a single day. Daily data is noisy and your attribution layer may still be settling.
Our perspective
Most teams we talk to are not short of data. They are short of one place where it fits together. Store consoles show visibility, an attribution tool shows sources, an analytics tool shows behavior, and the revenue sits somewhere else again.
We built Apptenium around the idea that tracking organic installs is a loop, not a report. You scan the listing, see what to fix, track the keywords and rivals that move your rank, and then read downloads, revenue and ad monetization next to it. When those sit in one view, a change in installs has a visible cause.
Our AI recommendations are designed to give copy-ready fixes from each scan, so the step from “we found a gap” to “we shipped a change” is short. That is the part that compounds over time.
Mike
Track organic growth with Apptenium
If you want the listing work, keyword tracking and performance data in one place, Apptenium combines ASO scanning, competitor intelligence and keyword tracking with reporting on downloads, revenue, subscriptions and ad monetization, and connects with Firebase and Google Analytics. You can see what each part does on the ASO tools page and the app analytics page.
The Free plan includes a limited number of scans per month, and Pro is $9.99 per month. Start on the pricing page.
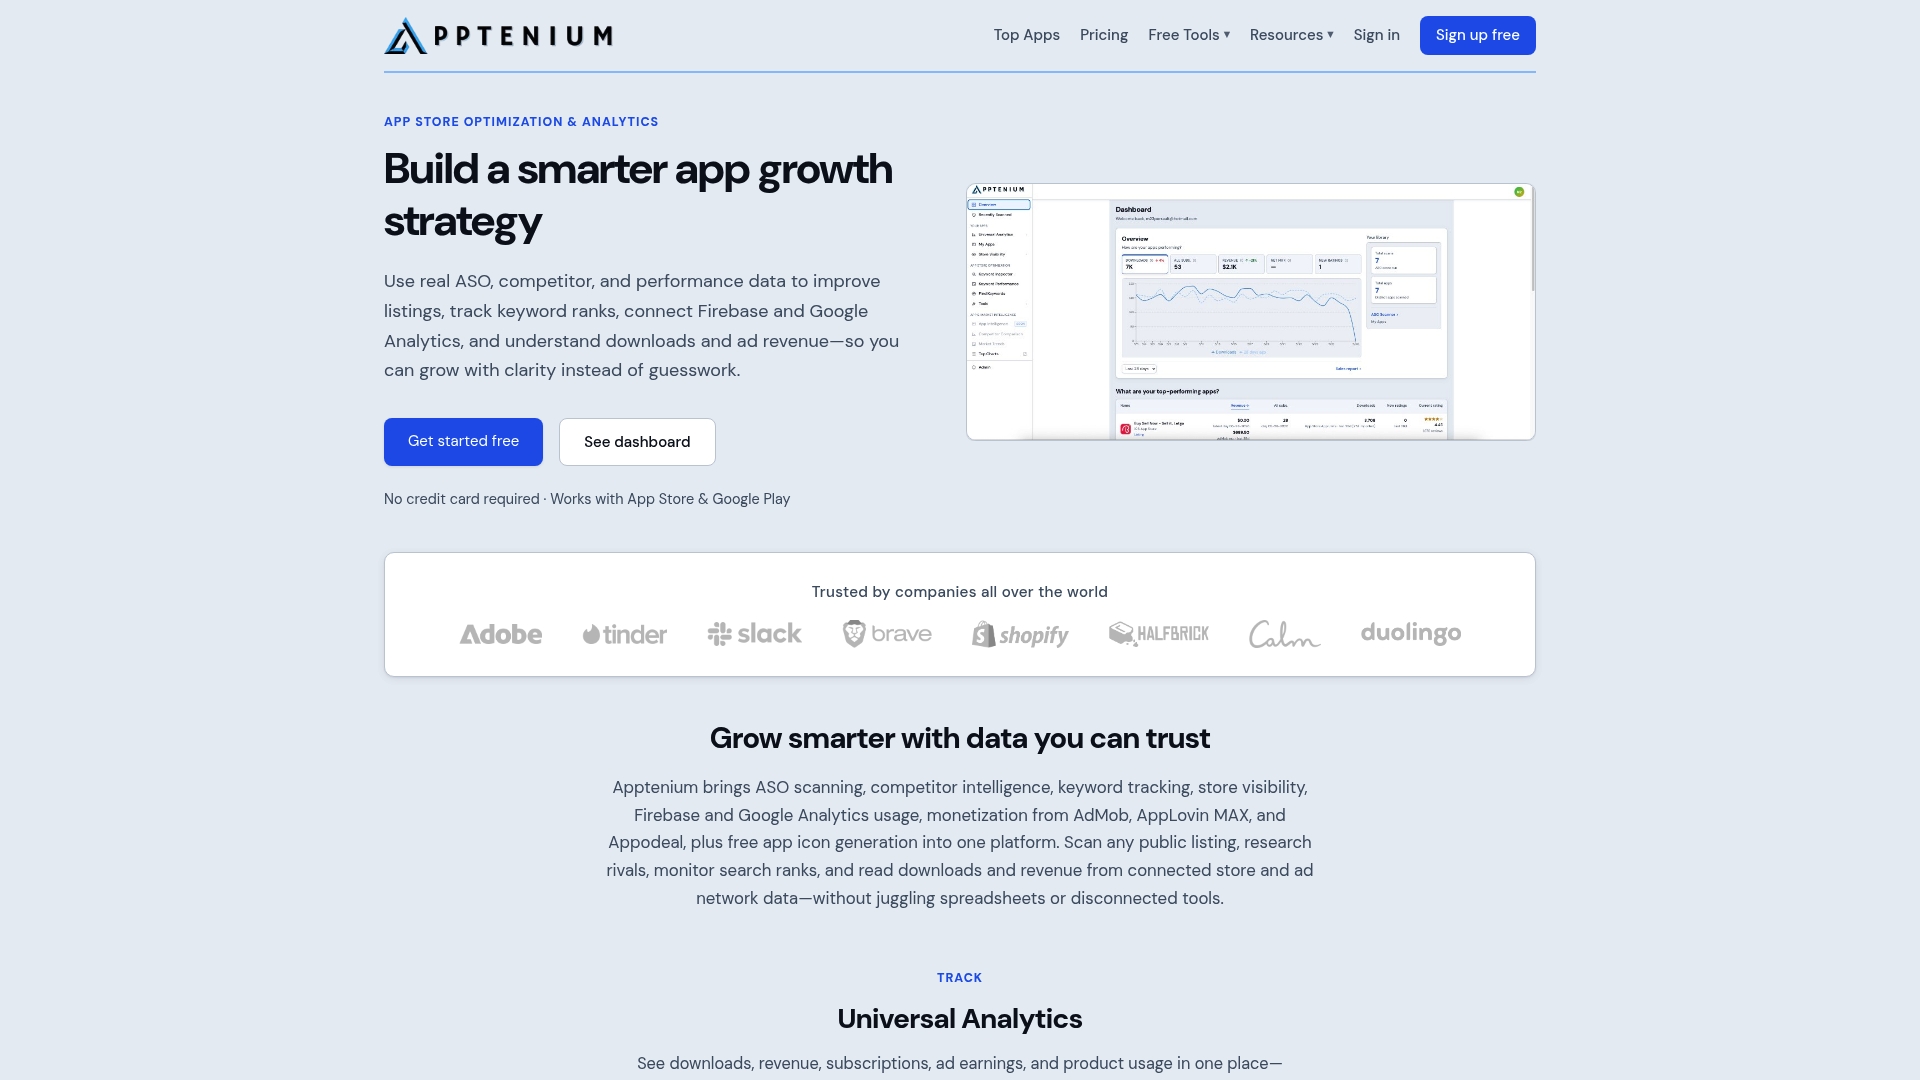
To see how rivals shape your visibility, explore competitor intelligence and compare their keywords with yours.
FAQ
Can I track organic installs without a paid attribution tool?
Yes, for a baseline. App Store Connect and Play Console both report downloads by source for free. Add Firebase or Google Analytics if you want behavior after install, and keep Apple Search Ads reporting beside the App Store numbers.
Why is my organic count higher in one dashboard than another?
Definitions differ. Stores count installs, SDKs usually count first opens, and attribution windows decide which installs get credited to ads. Pick one source per question and compare trends rather than exact totals.
Is Google Play or the App Store easier to measure for organic?
Google Play is cleaner, because its Search and Explore channels exclude paid traffic. On iOS, Search and Browse can include Apple Search Ads, so you need that separate reporting to estimate organic.
What should I measure besides installs?
Track impressions, page conversion, first-open latency, retention and revenue by source. These show whether organic installs are turning into engaged, paying users.
Sources
- Attribution Window: Click-Through and View-Through Windows
- Acquisition: App Store Connect Analytics Help
- Cross-Platform Growth Measurement
- View app statistics: Play Console Help
- How to Analyze App Download Data in Google Play Console
- Google Play Store: Mozilla Data Documentation
- Mobile App Download & Install Tracking
- Never Reprint App Download QR Codes Again