Audit Revenue Fast: API First Ad Network Reporting for App Marketers

Audit Revenue Fast: API First Ad Network Reporting for App Marketers
Ad network reporting is the consolidated measurement of ad requests, delivery, engagement, and revenue across your ad networks and mediation layer. Done right, it gives you one source of truth for monetization decisions and lets you calculate ARPU and LTV without second-guessing the numbers. Standards from AdMob’s Ads Activity report and Firebase’s analytics documentation, plus various platforms all point to the same conclusion: fragmented dashboards cost you accuracy.
TL;DR:
- Pull raw network API data to ensure the most accurate ad revenue reconciliation and avoid inaccuracies caused by mediation aggregation.
- Normalize ad impression data with precise parameters for platform, source, currency, and value before ingestion, and validate events in real-time to prevent silent errors.
- Use a weekly workflow to compare network API totals with mediation dashboards and investigate discrepancies caused by dimension filters, currency mismatches, or time zone issues.
- Rely on hourly log-level monitoring for high-value placements and large portfolios to maintain precision in revenue tracking.
- Consolidate ad network reporting into a single platform to better connect monetization performance with app store visibility and marketing insights.
Table of Contents
- What Ad Network Reporting Covers and Why It Matters
- Where to Pull Your Reporting Data From
- How to Implement Accurate Ad Revenue Measurement
- Common Pitfalls That Quietly Break Your Numbers
- A Reporting Workflow You Can Actually Run Weekly
- Why API-First Reporting Beats Convenience Every Time
- Centralize Your Ad Network Reporting With Apptenium
- Sources
- FAQ
What Ad Network Reporting Covers and Why It Matters
Ad network reporting tracks a specific set of metrics and dimensions, and once you know them, every dashboard starts to make sense. The core numbers are ad requests, filled requests, fill rate, impressions, clicks, click-through rate (CTR), and eCPM or estimated earnings. Each metric gets sliced by dimension: ad source, ad unit, country, and platform.
Publishers, app marketers, and agencies all lean on these reports, but for different reasons:
- Network selection: comparing fill rate and eCPM across networks to decide where to route traffic.
- Mediation adjustments: tuning waterfall order or bidding floors based on which source actually pays out.
- Pricing and forecasting: setting revenue expectations for new markets or ad units.
These granular metrics roll up into the numbers that actually drive business decisions. Fill rate and eCPM feed directly into ARPU calculations, and ARPU compounds into LTV, the figure that determines how much you can spend to acquire a user. Get the raw metrics wrong, and every downstream decision inherits the error.
Where to Pull Your Reporting Data From
You have three realistic sources for ad monetization reporting, and each serves a different purpose. Per-network dashboards and APIs are your source of truth. They reflect exactly what that network calculates before any mediation layer touches the number. Mediation platforms, by contrast, aggregate revenue across networks for a faster read on overall performance, though they can miss partner-specific detail. Third-party aggregators sit on top of both, useful for quick cross-app comparisons but rarely precise enough for reconciliation.
AdMob’s unified reports illustrate the trade-off well. The Ads Activity report blends Network, Mediation, and Bidding data into a single view, while separate Mediation and Network reports isolate each layer when you need to audit a specific source. Xandr’s network analytics reporting offers a similar split, with distinct report types for network-level and billing-level detail, as described in its network analytics documentation.
In practice:
- Use network APIs when you’re reconciling revenue or need log-level accuracy.
- Use mediation reports for a fast daily pulse on aggregate performance.
- Use unified dashboards when you need one number for a stakeholder meeting, not a full audit trail.
Singular’s guidance backs this up directly: pulling raw data from the network itself gives the most reliable read, since mediation-only connectors can smooth over partner-specific quirks that matter for accuracy.
How to Implement Accurate Ad Revenue Measurement
Getting ad revenue into your analytics stack correctly takes more than flipping on an SDK setting. Here’s the sequence that actually holds up under scrutiny:
- Instrument the
ad_impressionevent. Log it with parameters for ad platform, ad source, ad unit, currency (using the ISO 4217 code), and value formatted with a dot decimal separator. Firebase’s guidance is explicit here: get the currency and value parameters right or your revenue figures will be silently wrong. - Validate before you trust it. Check Realtime or DebugView in Firebase to confirm events are firing within the expected window, then sample a BigQuery export to catch formatting issues before they scale.
- Set up a connector per network. Don’t rely on one mediation feed to represent every partner. When revenue accuracy matters, a per-network API pull beats a blended aggregate every time.
- Automate ingestion for scale. Bulk feeds or log-level data (LLD) handle high-volume historical queries far better than repeated API calls. When requesting a report from a network API, specify the date range, dimensions (ad source, country, ad unit), and metrics (impressions, eCPM, revenue) explicitly rather than pulling everything by default.
Pro Tip: Run a side-by-side check for your first two weeks: pull the same date range from the network API and from your mediation dashboard. Any gap wider than a few percentage points usually points to a currency mismatch or a missed ad source dimension, not a real discrepancy in delivery.
Common Pitfalls That Quietly Break Your Numbers
Most ad network reporting errors aren’t dramatic. They’re small formatting or attribution mistakes that compound over weeks until your LTV model looks nothing like reality.
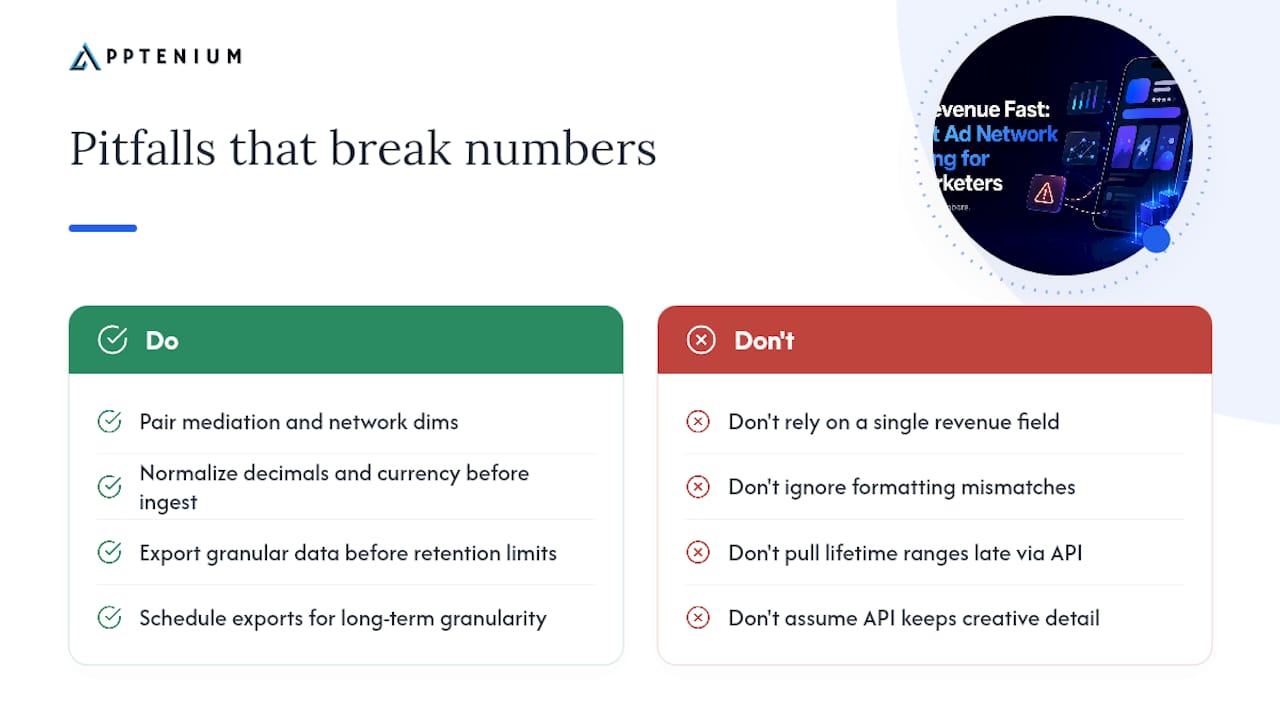
Double-counting is the most common culprit. When a bidding source appears both in-network and through mediation, using only one of the two available dimensions causes trouble. AdMob’s own guidance recommends pairing ad source with ad source (full list) to separate mediated and in-network revenue correctly rather than relying on a single field.
Formatting mismatches cause quieter damage. A decimal comma instead of a dot, or a currency field left unnormalized, will silently distort your revenue values before they ever hit your analytics dashboard. Normalize both before ingestion, not after.
Retention limits deserve planning, not surprise. Xandr’s network analytics API reduces hourly granularity after 100 days and limits creative-level detail after 14 months. If you need year-over-year comparisons at a granular level, export to BigQuery or a BI tool before that window closes, since pulling a full lifetime range through the API directly often gets queued as resource-intensive and can fail outright.
A Reporting Workflow You Can Actually Run Weekly
A workable ad monetization analytics routine follows five steps: connect your sources, validate them in realtime or debug mode, normalize the schema across networks, surface KPIs in a BI tool, and archive the raw feeds before retention windows close.
Break that into a rhythm:
- Daily: revenue by network, fill rate, top five apps or countries by earnings, and a quick scan for currency mismatches.
- Weekly: trend lines on eCPM by ad unit, mediation waterfall performance, and a reconciliation pass comparing network API totals against mediation dashboard totals.
- On alert: if revenue drops more than expected, pull the raw API export, the mediation report, and any third-party aggregator numbers side by side. The discrepancy almost always lives in one of three places: a dimension filter, a timezone offset, or a currency field.
Pro Tip: Keep a running log of past discrepancies and their root causes. Six months in, that log becomes the fastest diagnostic tool you have, faster than re-reading API docs every time a number looks off.
Why API-First Reporting Beats Convenience Every Time
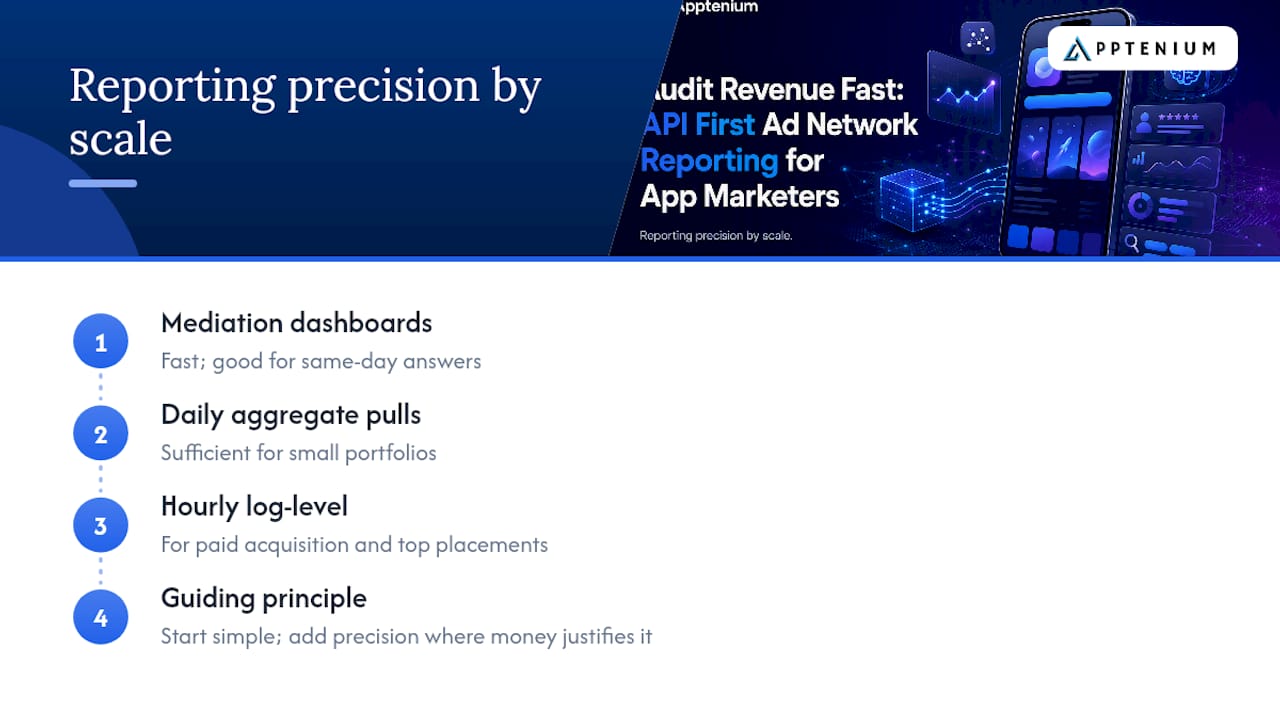
Mediation dashboards are fast, and that speed has real value when you need a same-day answer. But they were never built to be forensic tools. If your team is making budget decisions off a number that came from a blended feed, you’re trusting an approximation.
The scale of your app decides where to put engineering effort. Small portfolios get by fine on daily aggregate connector pulls. Once you’re running paid acquisition against ad revenue LTV, though, graduate to hourly log-level monitoring for your top-earning placements. Start simple, add precision exactly where the money justifies it.
— Mike
Centralize Your Ad Network Reporting With Apptenium
Certain platforms replace the spreadsheet-and-tab-switching routine most app marketers default to. Instead of checking one dashboard for downloads, another for ad revenue, and a third for keyword rankings, these platforms pull Firebase, Google Analytics, and ad network connectors into a single view.
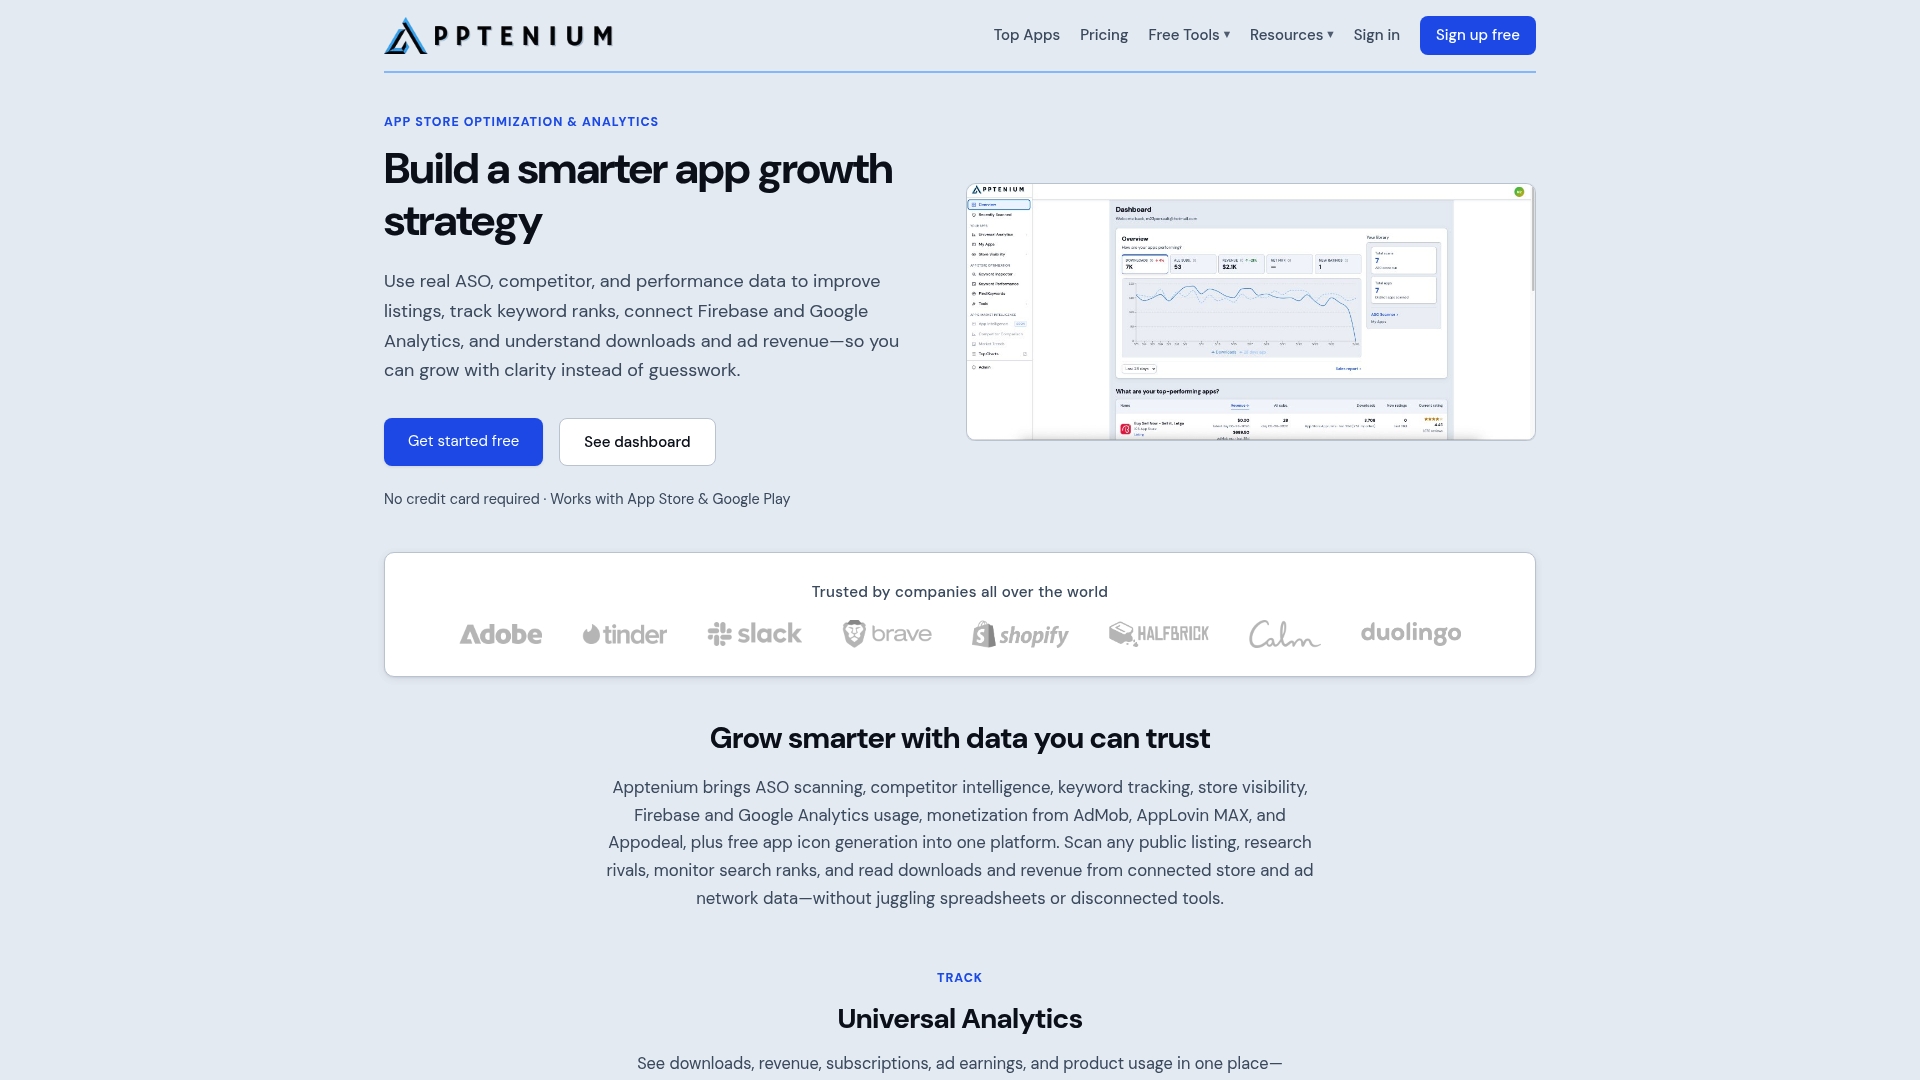
That consolidation matters most when you’re trying to connect monetization performance to app store visibility. A ranking dip that coincides with a revenue drop is easy to miss across three separate tools and obvious the moment they sit side by side. Apptenium’s AI-driven recommendations flag listing issues that might be suppressing installs, while the same dashboard tracks how those installs translate into ad revenue and subscription performance. For app marketers comparing platforms before committing, the ASO features overview breaks down exactly which integrations and reporting tools come standard. If you’re also monitoring competitor ad activity as part of your reporting routine, a tool like SignalEngine’s competitor ad tracking pairs well alongside your revenue dashboards. Start with a free scan on a platform like this to see how your current reporting setup measures up.
Sources
- Ad Monetization Analytics FAQ – Singular Help Center
- Using your Ads Activity report - Google AdMob Help
- Measure ad revenue | Google Analytics for Firebase
- Network Analytics | Microsoft Learn
FAQ
What Is an Example of an Ad Network?
Google AdMob and Microsoft’s Xandr platform are both examples of ad networks that provide reporting APIs and dashboards for tracking impressions, fill rate, and revenue.
Is There a Way to Report an Ad?
Reporting a problematic or inappropriate ad as a user is a separate process from ad network reporting for marketers. It’s typically handled through an in-app flag or report button tied to that specific ad network’s policy tools, not through the performance dashboards covered in this guide.
Do Ad Networks Still Exist?
Yes. Ad networks remain a core part of app monetization, and most publishers now combine several networks through mediation platforms rather than relying on just one.
What Is an Ad Report?
An ad report is a structured breakdown of advertising performance metrics, typically impressions, clicks, fill rate, and revenue, broken out by dimensions like ad source, country, or platform. Tools like Apptenium consolidate these reports across networks so you’re not reconciling numbers across five different logins.
How Do I Optimize My Ad Network Reporting?
Start by standardizing your metrics and dimensions across every network, validate your ad_impression instrumentation with Firebase’s DebugView, and reconcile revenue gaps weekly using raw network API data as your source of truth rather than mediation aggregates alone.